Karawang (Indonesia) - Analyse the risk
About
This study examines water scarcity risks in Karawang, Indonesia under current and future conditions. The risk of water scarcity is evaulated for 30 sub-regencies located in Karawang regency. The water availability are made using hydrological model WFLOW. WFLOW is an open-source hydrological software developed by Deltares to model all catchment hydrological processes, accounting for precipitation, interception, evapotranspiration, soil water, surface water, and groundwater recharge in a fully distributed environment.
The data used for WFLOW simulation includes ERA5 (the Fifth Generation of the European Centre for Medium-Range Weather Forecasts (ECMWF) Reanalysis) for the period of 2013-2022. For the projection (years 2023-2045), input data utilizes the Shared Socioeconomic Pathways (SSP 370) developed by the Geophysical Fluid Dynamics Laboratory (GFDL). The demand are based on the three main users (domestic, agriculture and industry). The historical vulnerability is based the vulnerability to drought of 2022 by Regional Development Planning Agency of Karawang Regency, 2022 and the projection follos the trends of future GDP growth of Indonesia according to SSP2 and SSP3 scenarios. For a more detailed explanation of the methodology, please click here
Future risk is assessed for two future scenarios: SSP2 (Middle of Road) and SSP3 (Fragmentation). A continuation of current population and GDP growth trend – urbanization trend continues, therefore, pressure on both domestic and industrial water demand will increase. Vulnerability levels decrease slowly as poverty levels will continue to decrease.
1. Introduction
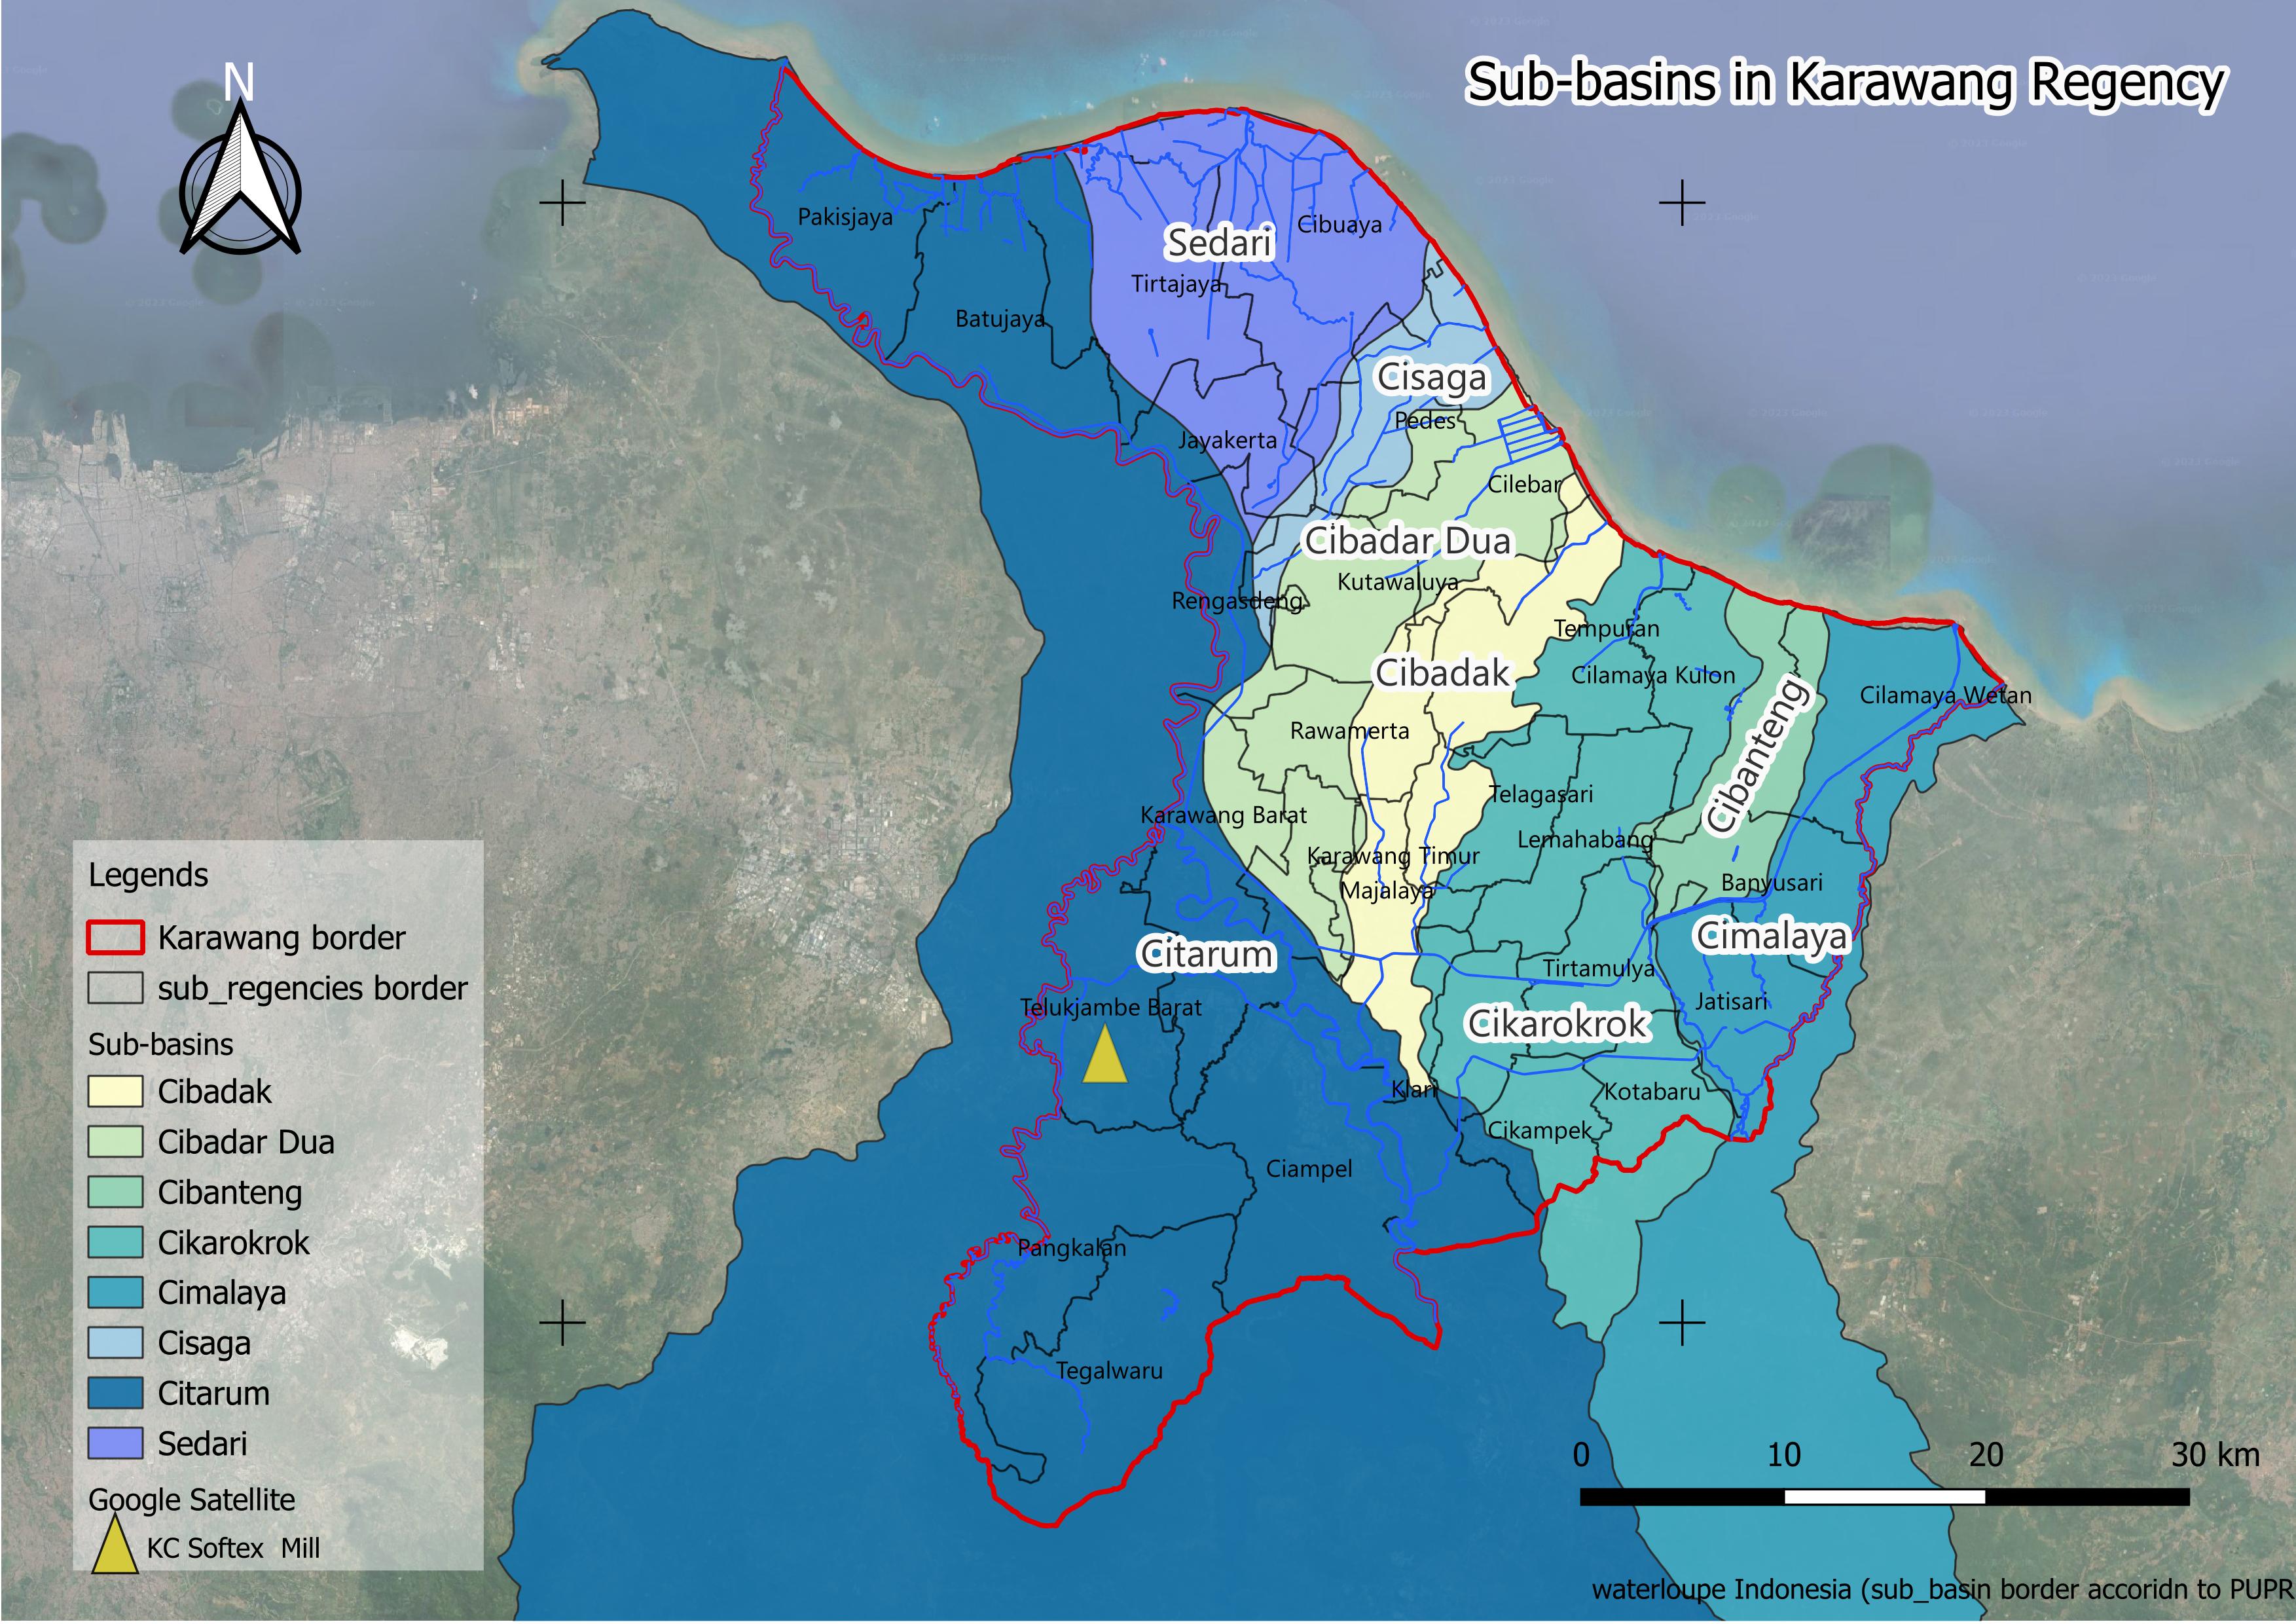
Karawang Regency lies in the north part of Province of West Java, which is geographically located between 107º02' – 107º40' East Longitude and 5º56' – 6º34' South Latitude . With total area of 1.911,09 km2 or 3,73 percent from West Java area with population in 2022 reached around 2.5 million (BPS of Karawang, 2023).
Karawang encompassess 30 Sub-regencies which are situated in different sub-basin, includes Citarum, Sedari, Cisaga, Cibadar Dua, Cibadak, Cikarokrok, Cibanteng, and Cimalaya. The topography of Karawang predominantly features a relatively flat plain, with altitudes ranging from 0 to 5 meters above sea level. Notably, the southern region of the regency exhibits altitudes between 26 and 1200 meters.
Recognized as an industrial city near Jakarta, Karawang plays a crucial role as a significant center for agriculture, primarily characterized by irrigated rice fields. However, Karawang regency shows a high risk indices for various disasters: floods (29.78), forest and land fires (29.78), extreme waves and abrasion (29.78), drought (19.85), and extreme weather (16.87) (BNPB, 2021).
The WaterLOUPE water scarcity risks dashboard calculates and presents the relative risks in the mentioned river sub-basins, now and in the future.
2. Water Scarcity Risk
Water Scarcity Risk
We defined water scarcity-related risks as those risks appearing as a consequence of water demand being higher than water availability. The water scarcity risk index is composed of the Water Gap Score and the Vulnerability Index. Sub-regencies in green have a lower water scarcity risk, while those in red have a higher water scarcity risk. Water availability (one of the components in the Water Gap Score) is estimated using the hydrological WFLOW model. However, it's important to note that the data for Karawang has not undergone calibration and does not include local water management, such as irrigation and the supply of water from outside the sub-district.
The selected sub-regency is shown as the highlighted area.
Historical Water Scarcity Risk (2013-2022)
Overall, most of the sub-districts belonging to the Citarum sub-basin have low water scarcity risks, including Telukjambe Barat, Pakis Jaya, Rengasdengklok, Karawang Barat, Karawang Timur, etc. This low risk is mainly driven by high water availability in this sub-basin.
The northern and eastern parts of Karawang (sub-districts along the coast) have a higher water scarcity risk (0.6-1). Despite the lower population density in these areas, they heavily depend on water supply to sustain irrigated rice fields. Fortunately, these locations are currently supplied by irrigation from the Jatiluhur reservoir.
Future Water Scarcity Risk (2023-2045)
The projection of water scarcity risk for both SSP2 and SSP3 scenarios shows that the sub-regencies currently facing water scarcity risks will continue to experience scarcity if no measures are implemented. In the period of 2030, it is projected that several locations (such as Tirtajaya and Cibuaya) will have a lower risk due to higher water availability within this period. However, in the longer period, these locations will also be at high risk of water scarcity (above 0.7).
Legend
Zero indicates the lowest, and one indicates the highest risk.
2.1 Water Scarcity Risk Plot
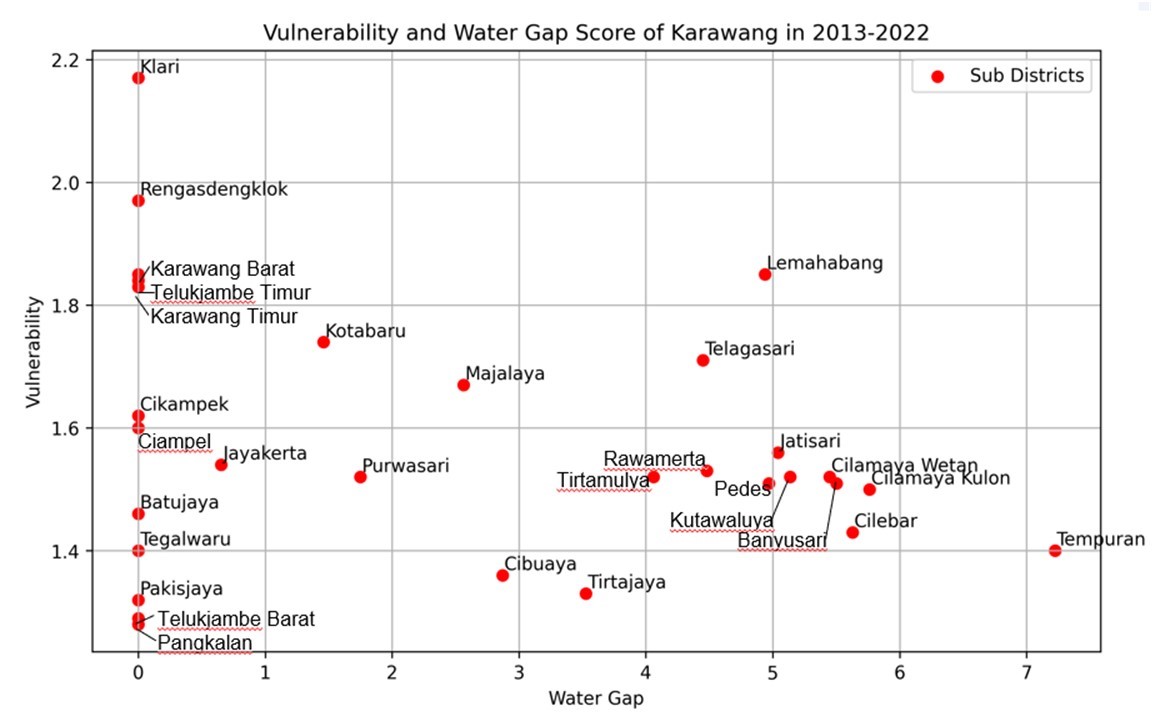
Lemahabang, Telagasari, Jatisari, and Pedes are sub-regencies most susceptible to water scarcity risk, characterized by high water Gap Scores and high Vulnerability. On the other hand, sub-regencies such as Klari, Rengasdengklok, Karawang Barat, Telukjambe Timur, and Karawang Timur exhibit high vulnerability. However, they demonstrate greater resilience due to their high water availability.
Tempuran stands out as a sub-district with notably low water availability but also low vulnerability, potentially rendering this area more resilient to water scarcity. Telukjambe Barat, Pakisjaya, and Pangkalan pose the lowest risk of water scarcity, boasting high water availability coupled with low vulnerability.
This plot shows the historical water condition in Karawang from 2013 to 2022 and remains relevant for future projections under both SSP2 and SSP3 scenarios.
3. Risk Assessment
3.1 Calculation approach
The WaterLOUPE water scarcity risk analysis shows the relative risks for the different sectors and user groups, now and in the future. The presented risk level of the area is the result of a combination of the hazard (drought conditions, reduced water availability), the exposure of water users in different sectors (domestic, nature, and economic) and the vulnerability levels of the different water users in the basin.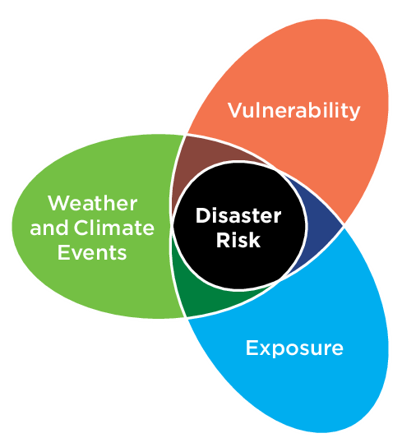
Risk is expressed through the Water Scarcity Index (WSRI), as a standardized measure of risk that can range from 0 (low or no risk) to 1 (maximum risk) at district-level and per consumer group/sector.
WSI index score is calculated by aggregating hazard, exposure and vulnerability scores, each quantified first separately.

Water scarcity risks are calculated using normalized hazard, exposure, and vulnerability indices. For more information, please refer to the methodology section at the end.
3.2 Hazard (water gap)
These maps show the results of the Water Gap Score, which is composed by Frequency, Persistence and Severity for the selected period.
The Water Gap Score shows that mostly sub-district in the North and South of Karawang have a water gap. Persistence and Severity are the two components of the index that contribute most to the Water Gap Score in this area.
Basins in green have a lower Water Gap Score, while the ones in red have a larger Water Gap Score.
Legend
Zero indicates the lowest, and one indicates the highest hazard.
3.3 Water Gap over time
This graph shows montlhy averages of surface water availability and the water demand in the selected sub-district for the period 2013 - 2045.
Overall, the surface water availability in Karawang changes every year. December to February are the months with the highest water availability, ranging from 300 to 1200 mcm/month, coinciding with the rainy season in Indonesia. Meanwhile, the lowest water availability, ranging from 60 to 350 mcm/month, occurs in June to August, which corresponds to the dry season in Indonesia.
Variations in water availability also depend on the sub-district's position in the basin or river. In the southern part of Karawang, including Telukjambe Barat, the water availability are considerably higher, as it is situated within a large Citarum sub-basin.
Variation in water availability between months and years is expected to occur. The average water demand for the period of 2013-2022 was 438.4 mcm/month (within this study, the demand was assumed to be equal for the whole months). In 2045, it is projected that the demand will reach 414.7 mcm/month under the SSP2 scenario and 415.2 mcm/month under the SSP3 scenario.
3.4 Water users
Agriculture is the primary contributor to the water demand in most sub-regencies in Karawang, with rice being the main commodity. The average rice production from 2013 to 2019 is nearly 1.5 million tons per year (BPS Karawang). The average water demand for agriculture was estimated to be around 428 mcm/month in the period of 2013-2022 and projected to slightly decrease in 2045 to 403 mcm/month, considering the local context of Karawang, which is expected to move towards more industry and domestic activities.
In several urban and industrial sub-regencies, such as Telukjambe Timur, Cikampek, and Kotabaru, domestic and industrial activities play a role in water demand. The total water demand for the industry in Karawang was estimated to be around 2.8 mcm/month in 2013-2022 and is expected to increase in 2045 to 3.45 mcm/month (under SSP3 scenario) and 3.3 mcm/month (under SSP2). Meanwhile, domestic water demand will increase from 7.1 mcm/month (in 2013-2023) to 8.63 mcm/month (under SSP3) and 8.27 mcm/month (under SSP2 scenario).
3.5 Vulnerability
Sub-regencies in the central part of Karawang exhibit higher vulnerability to drought. The primary factor contributing to this heightened vulnerability is the higher population density, indicative of social vulnerability, in these sub-regencies.
In the northern part of Karawang, near the coast where agriculture is prevalent, the vulnerability to drought is lower owing to the regulated priority water supply from the Jatiluhur reservoir. Nevertheless, this vulnerability could increase, particularly considering the high dependency of rice fields on water supply, especially if issues impede the irrigation supply.
Legend
Zero indicates the lowest, and one indicates the highest vulnerability.
4. Solution Strategies
4.1 From risk assessment to solution strategy
A next step when improving the water security in a basin, is the development of water scarcity solution strategies with all stakeholders. The solution strategies are expected to improve the water security at short to medium time scales, but should also enable the possibility to adapt to future changes (both climatic and socioeconomic).
In the first phases of the development of solution strategies, the results of the water scarcity risk analyses provide information to prioritize areas, sectors, and user groups with high risk and basin characteristics needed to evaluate the technical, environmental, financial, economic and political suitability of measures in that specific basin.
5. Developing solution strategies
To compose a water scarcity solution strategy, various mitigation and adaptation measures need to be combined. To evaluate the suitability of measures for the specific basin information about their physical, environmental, socio-economic, and political characteristics context should be clear to all stakeholders.
WaterLOUPE 2.0 contains an Water Scarcity Actions Wayfinder that provides such information for a range of water scarcity solution measures. The Water Scarcity Actions Wayfinder can be viewed here.
Sources
- Water Availability
The water availability are made using hydrological model WFLOW. The simulation using ERA5(period of 2013-2022) and GFDL SSP370 (projection of 2023-2045).
Assumption:
1.The model has not been calibrated (but the magnitude is the same order with simulation instate PSH PUSAIR National Hydrological System)
2.Water exchange between basins are not included
3.The reservoirs has been included in the model but not other man-made infrastructures
Water Demand -
Irigation Water Demand :
- Based on land used (source of data: Indonesia.geospacial, 2019)
- Water demand for irigation = area of rice field x (1 liter/sec/ha) x efficiency factor
- efficiency factor = 0.65 (KP01: Guidelines for Irrigation Planning for Indonesia by Public Works)
- It was assumed that there would be a 3% decrease in rice field area approximately every 10 years.
Domestic Water Demand
- Demand: Population x water demand per person
- water demand per person = 100 L/person/day (average of small city, according to Ditjen Cipta Karya, 2006)
Industry Water Demand
- Water demand for Industry = 40 % of the domestic water demand (Guidelines for Industry Planning for Indonesia)