Methodology - Analyse the risk
1. Overview
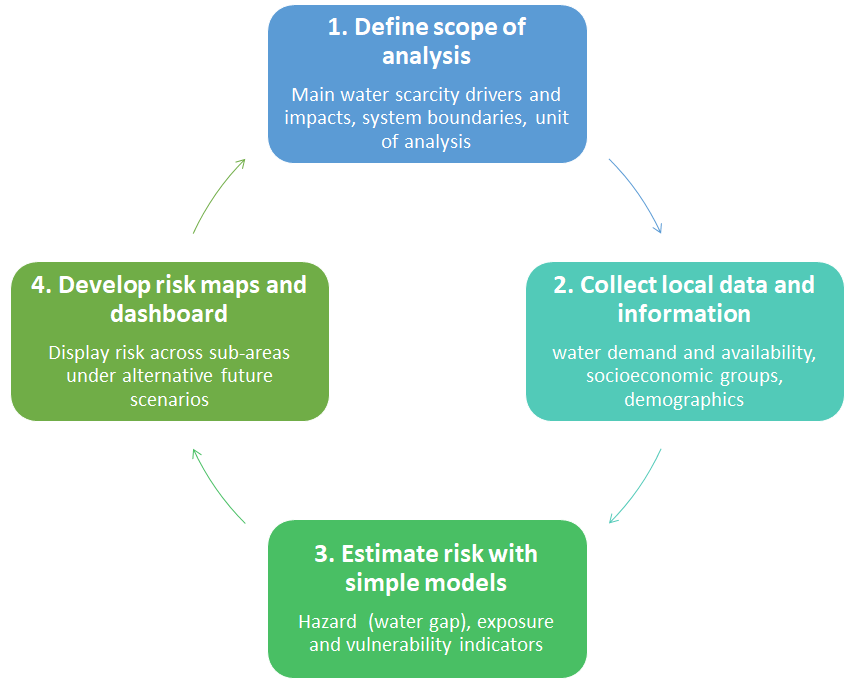
This section describes the stepwise WaterLoupe approach for analyzing water scarcity risk.
In the first step, publicly available sources are used to understand the main drivers and impacts of water scarcity. Main water users (such as domestic, agriculture, and industry) and socioeconomic groups within the study area are also identified. Based on this information, the scope of the analysis, including the system boundary and the unit of analysis, is defined. The results of this inception phase are discussed with local experts before further analysis.
In the second step, local information is collected, which may include data on hydrology, water availability, land use, water demand estimates, and population demographics. Global datasets are used as supplementary data sources when local information is limited.
In the third step, the risk of water scarcity is estimated using simple indicators of hazard, exposure, and vulnerability, which are translated into a normalized index score, which is referred to as the water scarcity risk index (WSRI). The water gap is calculated by comparing water demand and availability through simple mass balance models. Exposure and vulnerability indicators are calculated using simple economic concepts.
In the final step, water scarcity risk maps are developed to compare risk within the study area and across different water user groups. Possible future changes until 2050 are assessed using global socioeconomic scenarios (Shared Socioeconomic Pathways) that include climate changes and socioeconomic developments, as well as local changes such as increased water availability or decreased water demand. In some cases, adjustments to reflect local changes, including increased water availability or decreased water demand.
Qualitative approach for pollution, biodiversity and regulatory risks
In many cases not for all relevant aspects and water users, enough data and information are available to quantify the water scarcity risks as decribed here. For those aspects, the WaterLOUPE water scarcity risk assessment is enriched with qualitative information to provide a full overview of (potential) risks. In most cases, additional qualitative information was gathered for water quality and pollution, nature and biodiversity, and regulatory risks.
2. Water Scarcity Risk Index
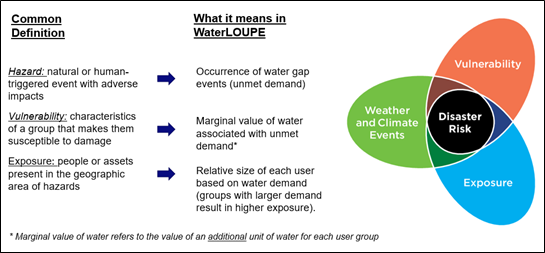
Water scarcity risk results from a water gap (or unmet demand), which occurs when water demand exceeds water availability. However, not every sector is affected by a water gap in the same way. For example, poor communities are generally more vulnerable due to their low coping capacity. And in areas that have a very big industrial sector, this sector is much more exposed than other water users.
To consider these aspects of water scarcity risk, we make use of the common risk components ‘hazard’, ‘vulnerability’, and ‘exposure’ (Intergovernmental Panel on Climate Change, 2017). In the WaterLOUPE approach, the ‘hazard’ consists of the occurrence of a water gap (or unmet demand), which is the difference between water availability and water demand. This is an adjustment to the above described “classical” risk approach.
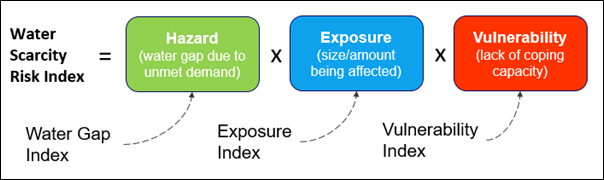
In WaterLOUPE, we developed a novel approach to express water scarcity risk, which we call as “Water-Scarcity Risk Index” (WSRI). WSRI provides a standardized measure of risk in a study area with a scale from 0 (no risk) to 1 (maximum risk). It is calculated at thedistrict or municaplity level and per water user group (sector). The WSRI is calculated by multiplying hazard, exposure and vulnerability components, each quantified by their own index scores ranging from 0 (best case) to 1 (worst case):
- Hazard is based on the occurrence of a water gap (unmet demand) and its characteristics (frequency, severity, and persistence);
- Exposure quantifies the size of the water user group and retrieved from the historic water demand and socioeconomic projections;
- Vulnerability quantifies to what extent a water user can cope with a water gap.
2.1 Water Gap Index (hazard)
In the context of WaterLOUPE, we developed a Water Gap Index (WGI), based on previous literature on simple water deficit metrics (Hashimoto et al. 1982; McMahon et al. 2006). In simple terms, a water gap (or unmet demand) occurs when the water demand exceeds water availability. The negative impacts of water gaps can be expressed as a function of three features:
- Occurrence frequency: on average, how often does a water gap occur?
- Persistence: on average, how long does a water gap last?
- Severity: on average, how large is the water gap?
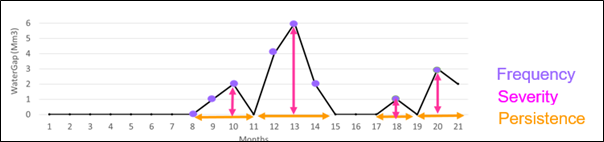
These three components are calculated as follows:
- Calculate monthly water deficit series based on water demand and availability. Identify the times when a water gap occurs, e.g., the times when the difference between demand and availability is greater than zero.
- Next, using the water deficit series, calculate frequency, persistence, and severity metrics for each analysis period (see provided equations for each component). Each component yields a score from 0 (least concerning) to 1 (most concerning).
- After calculating the score of each component, we then take their simple arithmetic average to estimate the water gap index (WGI) score. This results in a Water Gap Index for each of the municipalities in the research area. The WGI is the same for all water users in a municipality.
![]()
2.2 Exposure Index
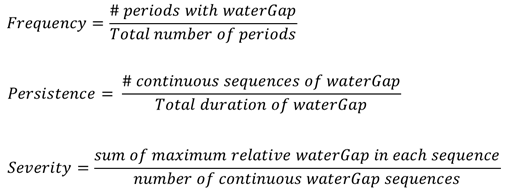
The exposure to water scarcity is distinguished for all water user groups (or sector). The exposure accounts for the relative size of each water user group and is based on their demand: groups with larger demand will get a in higher exposure. The exposure of a given user group is calculated using the following equation:
Where Demandusergroup is the demand of a given sector and and are the demand of the sectors with respectively the smallest and largest water demand. In other words, the exposure of a water user group equals the relative demand of that user group (relative to all other water user groups), normalized between 0.5 and 1. This results in an exposure for each water user group and is different for each municipality.
2.3 Vulnerability Index
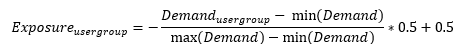
Vulnerability refers to the degree of susceptibility to, and inability to cope with, the adverse effects of water scarcity. Due to differences in coping capacity, a water deficit impacts every water user or sector differently. In other words, the utility or value of a certain volume of water differs per user. This can be explained by the following line of thought:
- Based on the diminishing marginal utility function of income or consumption: One dollar has much more value or utility for a person earning 100 dollars a month, than for a person earning 1000 dollars a month.
- The same accounts for water: One additional liter of water for a person using 10 liters a day has much more value or utility than one additional liter of water for a person using 100 liters a day.
- Or in the case of water scarcity: One liter of water less for a person using 10 liters a day is much more severe (higher utility) than one liter of water less for a person using 100 liters a day
The way in which water scarcity manifests in the day-to-day life of people can differ substantially within a population, with some hardly bearing any consequences while others tipping below a survival threshold. This not only depends on their level of exposure to the water shortage, but moreover on their levels of sensitivity and adaptive capacity.
In the WaterLOUPE analysis, a Vulnerability Index is determined per user group or sector and in case of the domestic sector it is determined per sub-group. The theory behind this is “the law of diminishing marginal utility”. The graphs show that additional consumption leads to higher utility. But, the added value of every additional unit of consumption decreases. The additional value derived from consumption is higher when consumption is low, and lower when consumption is high (concave shape of the curve).
To calculate Vulnerability Factors of the domestic sub-groups, the following equation was used:
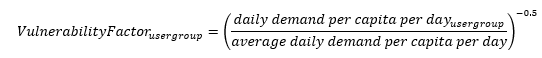
Where daily demand per capita per day is the daily water usage for a person in a given water user group and average daily demand per capita per day equals the average demand all domestic water users. This approached is based on work by Kind et al., 2017.
The Vulnerability Factor of the industrial sector was assumed to be equal to the average of the Vulnerability Factors of the domestic water user groups. The Vulnerability Index of the agricultural sector is assumed to be equal to 0.5 (Briscoe, 1996).
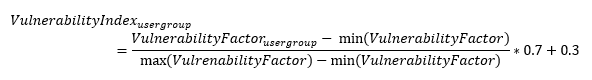
Finally, the Vulnerability Indices of the (sub-)sectors / (sub-)groups were determined by normalizing the Vulnerability Factor between 0.3 and 1:
3. Future scenarios
In order to assess water scarcity risks in the future decades (until 2050), we develop case specific scenarios that enable us to estimate the changes in water gap as well as the changes in exposure (changes in water demand for the different water users / sectors). These scenarios comprise of both future climate and socioeconomic changes and are developed to provide a realitsic bandwith of future water scarcity risks until 2050. In some cases, major measures that are planned for the basin are also taken up in the future scenarios.
In most cases we develop two future scenarios during an analyses by a team of experts. If possible, the selection and further refinement of the scenarios is done during a local stakeholder workshop.
3.1 Climate scenarios
In the last Assessment Report of IPCC (AR5), the approach to define the scenarios has focused on a parallel development of emissions and socioeconomic scenarios. The starting points of these scenarios are radiative forcing pathways that describe an emission trajectory and concentration by the year 2100. These radiative forcing trajectories are termed “Representative Concentration Pathways” (RCPs) and are broadly described as “climate scenarios”. The RCPs can either be or not be associated with unique socioeconomic and policy assumptions. They can also result from different combinations of economic, technological, demographic, policy, and institutional futures. There are four radiative forcing scenarios which are defined depending on the total radiative forcing in year 2100 relative to 1750. Scenario 2.6 is a mitigation scenario in which the emissions peak and decline before 2100. Scenarios 4.5 and 6.0 are stabilization scenarios and scenario 8.5 is a rising scenario with very high greenhouse gas emissions. The IPCC generated a set of data based on the new climate simulations carried out with the climate model ensemble under the framework of the Coupled Model Intercomparison Project Phase 5 (CMIP5) and using the RCPs as basis.
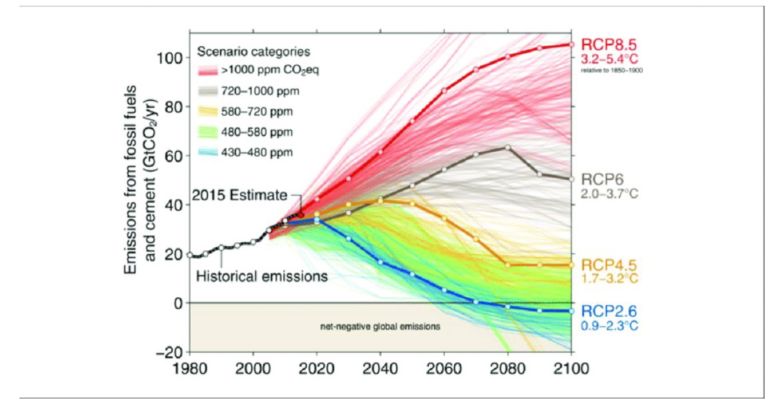
Image Credit: Neil Craik, University of Waterloo
For the purpose of WaterLOUPE future water shortage risk calculations, one or two RCP climate scenarios are selected during the expert analysis and, if possible, disucssed during a local stakeholder workshop. In most cases, the RCP8.5 and RCP 4.5 scenarios are regarded as most relevant for the assessment of possible future water scarcity risks. The RCP8.5 climate scenario represents a worst-case scenario in which temperature increases, and precipitation increases during the wet seasons and decreases during the dry ones. The RCP4.5 scenario represents a scenario with limited climate change.
Reference: van Vuuren, D.P., Kriegler, E., O’Neill, B.C. et al. A new scenario framework for Climate Change Research: scenario matrix architecture. Climatic Change 122, 373–386 (2014). https://doi.org/10.1007/s10584-013-0906-1
3.2 Socioeconomic scenarios
The aim of the socioeconomic scenarios is to understand how both exposure (water demand of various sectors) and vulnerability will develop in the future. Especially for the long-term horizon, it is impossible to predict socioeconomic change; therefore, instead of using a single projection, we identify multiple scenarios that enable us to deal with different ‘what-if’ outcomes. As such, it is possible to design policy that is effective in different future outcomes.
In order to derive plausible socioeconomic scenarios, the narratives and quantification of key drivers is derived from different global sources. Future population projections are derived from the United Nations and the IPCC (the ‘Shared-Socioeconomic Pathways’ – SSPs). The SSPs are also used for economic growth, sub-sectoral distribution and urbanization developments and directions of key vulnerability indicators. This is combined with local information on current abstractions of irrigation, households and industries in the relevant (sub-) catchments. Based on the different narratives, the future water demand distribution over different sectors and users is identified, as well as the vulnerability per user group. The narratives also include developments of legislation and regulation that influence water management. This is combined with different climate change scenarios to understand future risk under different scenarios for the different stakeholders in the catchment area. The following paragraph describes a short storyline per SSP.
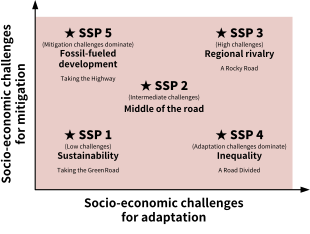
SSP1 (Sustainability) represents a sustainable world where it is easy to mitigate and adapt to climate change because of the rapid development of low-income countries, reduced inequality, rapid technology development, and a high level of awareness regarding environmental degradation. Good yield enhancing technologies for agricultural land are also incorporated.
SSP2 (Middle of the Road) represents conditions where the socioeconomic trends of recent decades continue. Reductions in resource use and energy intensity are achieved at historic rates.
SSP3 (Fragmentation or Rocky road) represents conditions where it is difficult to mitigate and adapt to climate change because of extreme poverty and a rapidly growing population. There is serious degradation of the environment, and technological change in the energy sector is slow. Because of the limited coordination between regions, use of local energy resources is enhanced.
SSP4 (Inequality) represents a highly unequal world both within and across countries. Crop yields would be high in industrial farming, but low for small scale farming.
SSP5 (Conventional Development) represents a situation where it is easy to adapt owing to robust economic growth, but difficult to mitigate the effects of climate change because the energy system is dominated by fossil fuels. Agro-ecosystems are highly managed, building on strong technological progress in the agricultural sector. Land use management is generally very resource intensive including the management of water systems.
Reference: O’Neill, B.C., Kriegler, E., Riahi, K. et al. A new scenario framework for climate change research: the concept of shared socioeconomic pathways. Climatic Change 122, 387–400 (2014). https://doi.org/10.1007/s10584-013-0905-2
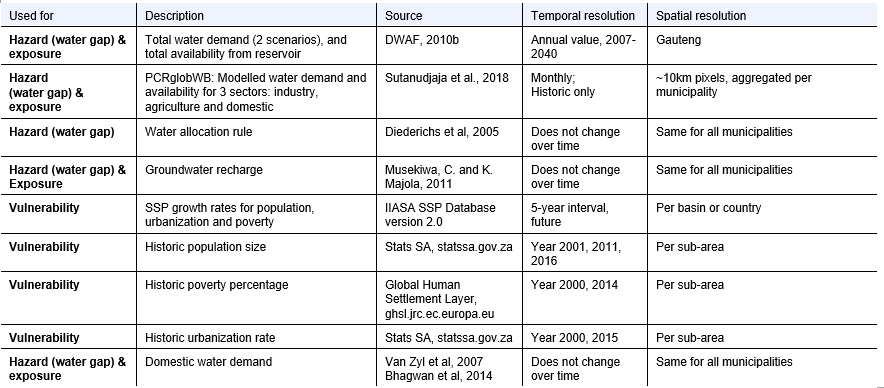
4. Data and information sources
For the WaterLOUPE water scarcity risk assessments we use a combination of local data and information as well as basin scale and national scale data. In addition, global data sets are used to fill information gaps, and to estimate future developments of water availability and water demand.
The table below provides an example of the combination of data sources that were used for the water scarcity risk assessment of the Gauteng area (greater Johannesburg).