Gauteng (Johannesburg) - Analyse the risk
More information future scenarios
To assess possible future water scarcity risks in Gauteng, two future scenarios were developed:
- High water requirement scenario (SSP5). This scenario is based on the assumption that current situation will continue into the future leading to increasing water demand. No water conservation measures are taken or any other measures to stimulate a decrease of the water demand (source: DRAF, 2010).
- Low water requirement scenario (SSP3). This scenario is based on the assumption that the water demand will decrease due to socio-economic development as well a by measures that focus on water conservation and water demand management (source: DRAF, 2010).
In the Gauteng province, water availability is dominated by the availability of water in the Vaal dam. Future water availability is determined by the transport of water from the Lesotho Highlands. Hence, whereas in other WaterLOUPE cases climate change scenarios were taken into account as a determining factor for future water availability, this was not done in the analysis of the Gauteng province. As a result, water availability is similar for both the high and low water requirement scenario.
1. Water scarcity risk
1.1 Introduction to the area
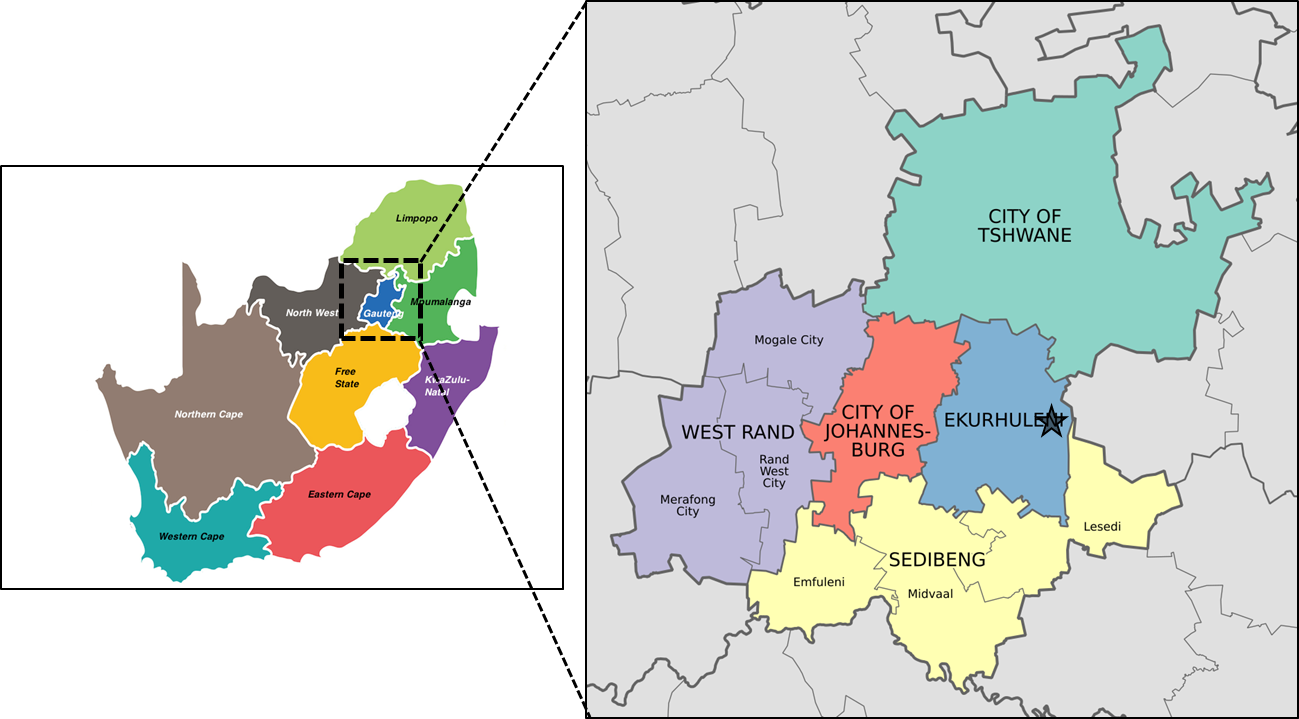
Gauteng (literally “Place of gold”) is the smallest province of South Africa and covers an area of 18 178km² or approximately 1.4% of the total surface area of South Africa. It is bordered by the Free State, North West, Limpopo and Mpumalanga provinces. While being the smallest province, it is also the most populous, being home to 13.4 million people – 24.1% of the national population. Gauteng lies on the highest part of the interior plateau on the rolling plains of South Africa’s Highveld.
In Gauteng lies Johannesburg as well as Pretoria, one of the capitals of South Africa (Figure 1.1), and also contains the City of Tshwane Metropolitan Municipality cities (Pretoria) and The City of Ekurhuleni Metropolitan Municipality. With that the province contains three metropolitan areas as well as two district municipalities, which are further subdivided into nine local municipalities: City of Johannesburg, Mogale City, Merafong City, Rand West City, City of Tshwane, Ekurhuleni, Emfuleni, Midvaal, and Lesedi.
1.2 Risk per municipality and water user group
The map shows the Water Scarcity Risk Index for each water user group and for each period of the analysis separately. When comparing the risk for the scenarios over time, it can be observed that in the “High water requirement” scenario the risk increases steadily until 2050 while for the “Low water requirement” scenario the risk is relatively low for the period between 2020 and 2040.
The differences of the water scarcity risks over time and between the two future scenarios are mainly driven by the differences in the water gap. Differences in exposure and vulnerability explain the differences of the water scarcity risks between the municipalities.
1.3 Main concusions
Current situation
The current water gap has a relatively limited magnitude compared to the total water availability, but it is very persistent (lasts over a long period). This persistence of the water gap is the main cause of the current water scarcity risk in the Gauteng province.
Differences in the water scarcity risks between municipalities and water users are caused by differences in exposure and vulnerability:
- The water user group “domestic below the poverty line” in rural areas has the highest water scarcity risk, mainly in the municipality of Tshwane.
- The water user groups “agriculture” and the “domestic above the poverty line” in urban areas have the lowest water scarcity risks, although in Tshwane the risk of these water users is somewhat higher than in the other municipalities.
- For agriculture, the relatively low water scarcity risk is driven by the low exposure (limited agricultural activities and agricultural water demand) and low vulnerability.
- In Johannesburg and Ekurhuleni, mainly the water user groups “industry” and “domestic sector the poverty line” have relatively high water scarcity risks.
Future scenario's
For the “High water requirement” scenario the water scarcity risks increase steadily until 2050, while for the “Low water requirement” scenario the water scarcity risks are relatively low for the period between 2020 and 2040. In both scenarios the water demand exceeds the availability after 2040, which leads to increased water scarcity risks.
Although the future changes are mainly province wide and driven by the differences in the water gap, some future changes in water scarcity risk are projected for specific municipalities and/or water user groups:
- water scarcity risks decrease for the domestic water users in Tshwane;
- water scarcity risks of the water user group “domestic below poverty line” in urban areas decreases in Johannesburg and Ekurhuleni;
- the future water scarcity risk of the industrial sector in Johannesburg and Ekurhuleni is relatively high in the future.
Other water scarcity risks
The Gauteng province faces different sources of water pollution:
- Sub-optimal management of sanitation systems, dumping and littering is currently regarded as the most threatening
- Various chemical pollutants, related to acid main drainage. These are reported to decline since 2011. However, based on available data, which is fragmented over various papers and reports, it is impossible to quantify the current risks of acid mine drainage.
Only 2.4% of the surface area of nature reserves that make up 44% of the Gauteng Province is adequately protected. Hence it is likely that part of the nature in non-protected areas faces water scarcity risks, eg. due to dropping groundwater levels or (ground) water pollution. Unfortunately, insufficient data was available to quantify those risks.
There are several regulatory and developmental risks that may influence water scarcity in the future:
- lack of environmental compliance enforcers (increasing risks of water pollution)
- potential fragility of the transnational water supply from Lesotho
- resistance of citizens against the National Water Act responsibilities.
2. Risk Assessment
2.1 Calculation approach
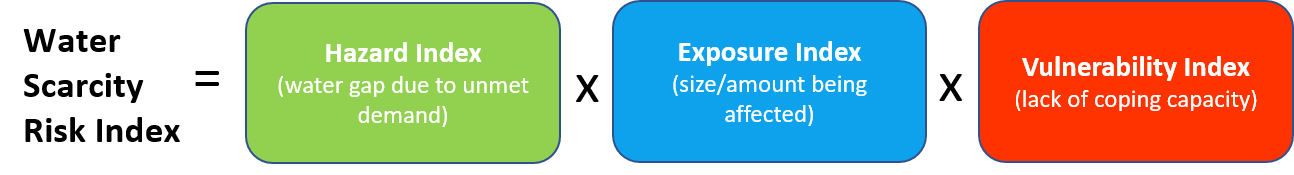
The WaterLOUPE water scarcity risk analysis shows the relative risks for the different sectors and user groups, now and in the future. The presented risk level of the area is the result of a combination of the hazard (drought conditions, reduced water availability), the exposure of water users in different sectors (domestic, nature, and economic) and the vulnerability levels of the different water users in the basin.
Risk is expressed through the Water Scarcity Risk Index (WSRI), as a standardized measure of risk that can range from 0 (low or no risk) to 1 (maximum risk) at district-level and per consumer group/sector.
WSRI index score is calculated by aggregating hazard, exposure and vulnerability scores, each quantified first separately.
2.2 Water demand and available resources
This chart provides information about water demand for the different sectors as well as the water availability for the selected sub basin. The information is averaged per 10 years.
The water availability in the Gauteng province depends largely on the Vaal dam, for which the by transnational water transports from the Lesotho Highlands is an important resource. For most municipalities, the reservoir provides approximately 90% of the water, which is supplemented by (local) groundwater resources.
There is a big difference in water demand between municipalities. Johannesburg has the highest water demand; this is approximately 25 times the water demand of Lesedi, the municipality with the lowest water demand. The demand of the urbanized municipality is Ekurhuleni and the relatively big agricultural municipality Tshwane are considerably high as well. Overall, the domestic water demand in the densely populated Gauteng province is larger than the water demand for agriculture and industry.
2.3 Water gap over time
This graph shows the total demand and availability for the selected sub basin and scenario over time.
In the “High water requirement” scenario the demand exceeds the availability from 2010 onwards for most of the time, despite the increase in water availability resulting from the Lesotho Water Project Phase 2. In “Low water requirement” scenario there is a “water conservation and water management” program in place. This leads to a lower water demand in the “Low water requirement” scenario, reducing the water gap. However, after 2040 also for this scenario the water demand exceeds the water availability, leading to a high Water Gap Index.
2.4 Water gap index
This map summarizes the water gap index scores of each subdistrict for the current conditions (2010-2020) through the color scheme from black (high hazard) to yellow (low hazard).
Calculated water gap scores are generally low (< 0.4) accross the entire basin indicated by the dominance of the green color. The water scarcity risk in Gauteng province is largely determined by the water gap of the area. While the current magnitude of the water gap which is limited compared to the total water availability, it is very persistent (lasts over a long period).
For the “High water requirement” scenario the water gap increases steadily until 2050, while for the “Low water requirement” scenario the water gap is relatively low for the period between 2020 and 2040 and increases towards 2050.
2.5 Exposure
Exposure to water gap is shown on the left, with a color scale ranging from black (highest) to yellow (lowest). Results are shown per sector *
Spatial variability of exposure is highest for the agriculture sector and the rural population above poverty line. For the remaining groups/sectors, exposure values are similar accros all sub-basins.
2.6 Vulnerability
The vulnerability chart refers to each water user group's characteristics, making them more susceptible to the negative consequences of water deficits.
For the Gauteng province, the vulnerability of each water user is defined based on common literature and assumed to stay the same over time. As a general rule of thumb, poorer populations are more vulnerable due to their limited coping capacity.
Legend: Zero indicates the lowest, and one indicates the highest vulnerability.
3. Solution Strategies
3.1 From risk assessment to solution strategy
A next step when improving the water security in a basin, is the development of water scarcity solution strategies with all stakeholders. The solution strategies are expected to improve the water security at short to medium time scales, but should also enable the possibility to adapt to future changes (both climatic and socioeconomic).
In the first phases of the development of solution strategies, the results of the water scarcity risk analyses provide information to prioritize areas, sectors, and user groups with high risk and basin characteristics needed to evaluate the technical, environmental, financial, economic and political suitability of measures in that specific basin.
3.2 Developing solution strategies
To compose a water scarcity solution strategy, various mitigation and adaptation measures need to be combined. To evaluate the suitability of measures for the specific basin information about their physical, environmental, socio-economic, and political characteristics context should be clear to all stakeholders.
WaterLOUPE 2.0 contains an information catalogue that provides such information for a range of water scarcity solution measures.