El Salvador - Analyse the risk
Year of development: 2023
1. Introduction
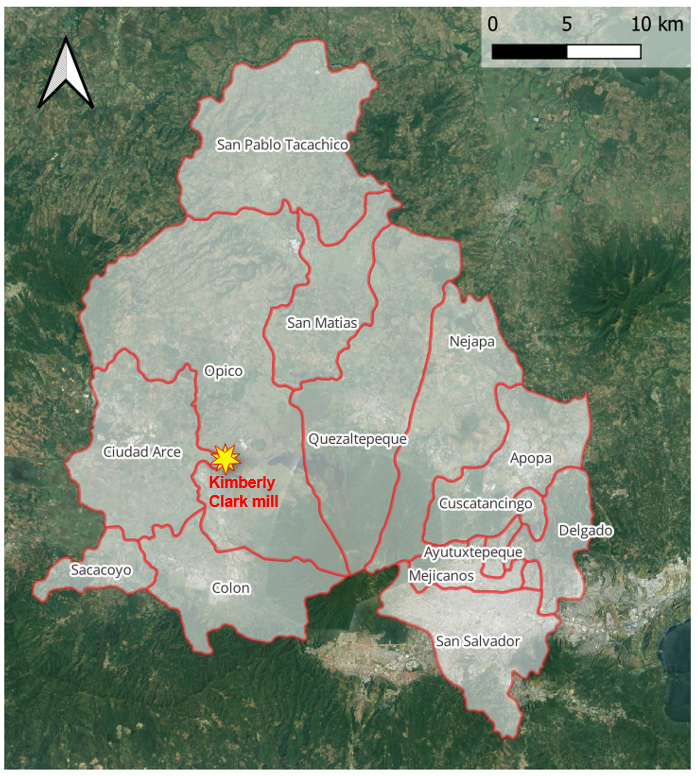 Kimberly Clark has a mill in El Salvador in the municipality of Opico in the Lempa basin at the shore of the Río Sucio.
The mill is located at 15km from the capital of the country, San Salvador. The city is home of over 238.000 inhabitants (data from 2018).
The climate of the country is warm with an average temperature of 25 degrees Celsius that ranges between 18 and 33 degrees Celsius, being the months of March to May the warmest.
Average yearly precipitation in the country is 1785 mm and evaporation is 1682 mm. In the last 20 years, precipitation has ranged between 1380 mm (year 2019) and 1995 mm (year 2008).
Precipitation is concentrated in the months May to October, being June and September the wettest months.
2. Water Scarcity Risk
Water Scarcity Risk Index
This map shows the results of the Water Scarcity Risk Index (WSRI). This index is composed by the Water Gap Index combined with Vulnerability for the selected period. Basins in green have a lower Water Scarcity Risk Index, while the ones in red have a larger Water Scarcity Risk Index.
The results show that under the SSP1 scenario, the water scarcity risk index is improving over time, while in the SSP3 it is increasing. This is mostly due to an increase of vulnerability and not an increase of the water gap.
For more information on the calculation of the Water Scarcity Risk Index and the Water Gap Index, please see section 3. Risk Assessment.
Current Conditions (2010-2020):
The analysis has shown that all municipalities (except Pan Pablo Tacachico) currently have intermediate to high Water Gap Index values. The parameters of persistence and severity are causing this increase, while frequency, in general, does not seem to affect the water gap significantly. In relation to vulnerability, the most vulnerable municipalities are San Pablo Tacachico and San Matías, while those with the lowest vulnerability are San Salvador and Mejicanos.
When combining the Water Gap Index with Vulnerability and calculating the Water Scarcity Risk Index, it is observed that Nejapa is the municipality with the largest risk. In the case of the sectoral analysis, San Salvador has the largest Water Gap Index for the domestic and industry sectors.
Future Conditions (2020-2050):
The SSP1 and SSP3 scenarios influence the values of demand. Out of the 3 demands considered (domestic, agriculture and industrial) the one with the largest effect is the domestic demand, which is influenced by the change of population over time.
In the case of the climate scenario RCP 8.5, it affects the surface and groundwater availability over time, showing both sources a decreasing trend over time.
Looking at the vulnerability, under the SSP1 scenario the basin is expected to be less vulnerable over time, while in the SSP3 scenario the opposite is true.
Both parameters (WGI and vulnerability) have shown that for both scenarios most of the study area will have a medium to high (SSP1) or high (SSP3) Water Scarcity Risk Index values. In both cases, Nejapa will be the one with the larger risk, while San Pablo Tacachico shows the lowest risk.
Similar to the historical period, in the case of the sectoral analysis, San Salvador has the largest Water Gap Index for the domestic and industry sectors.
2.1 Water Scarcity Risk Plot
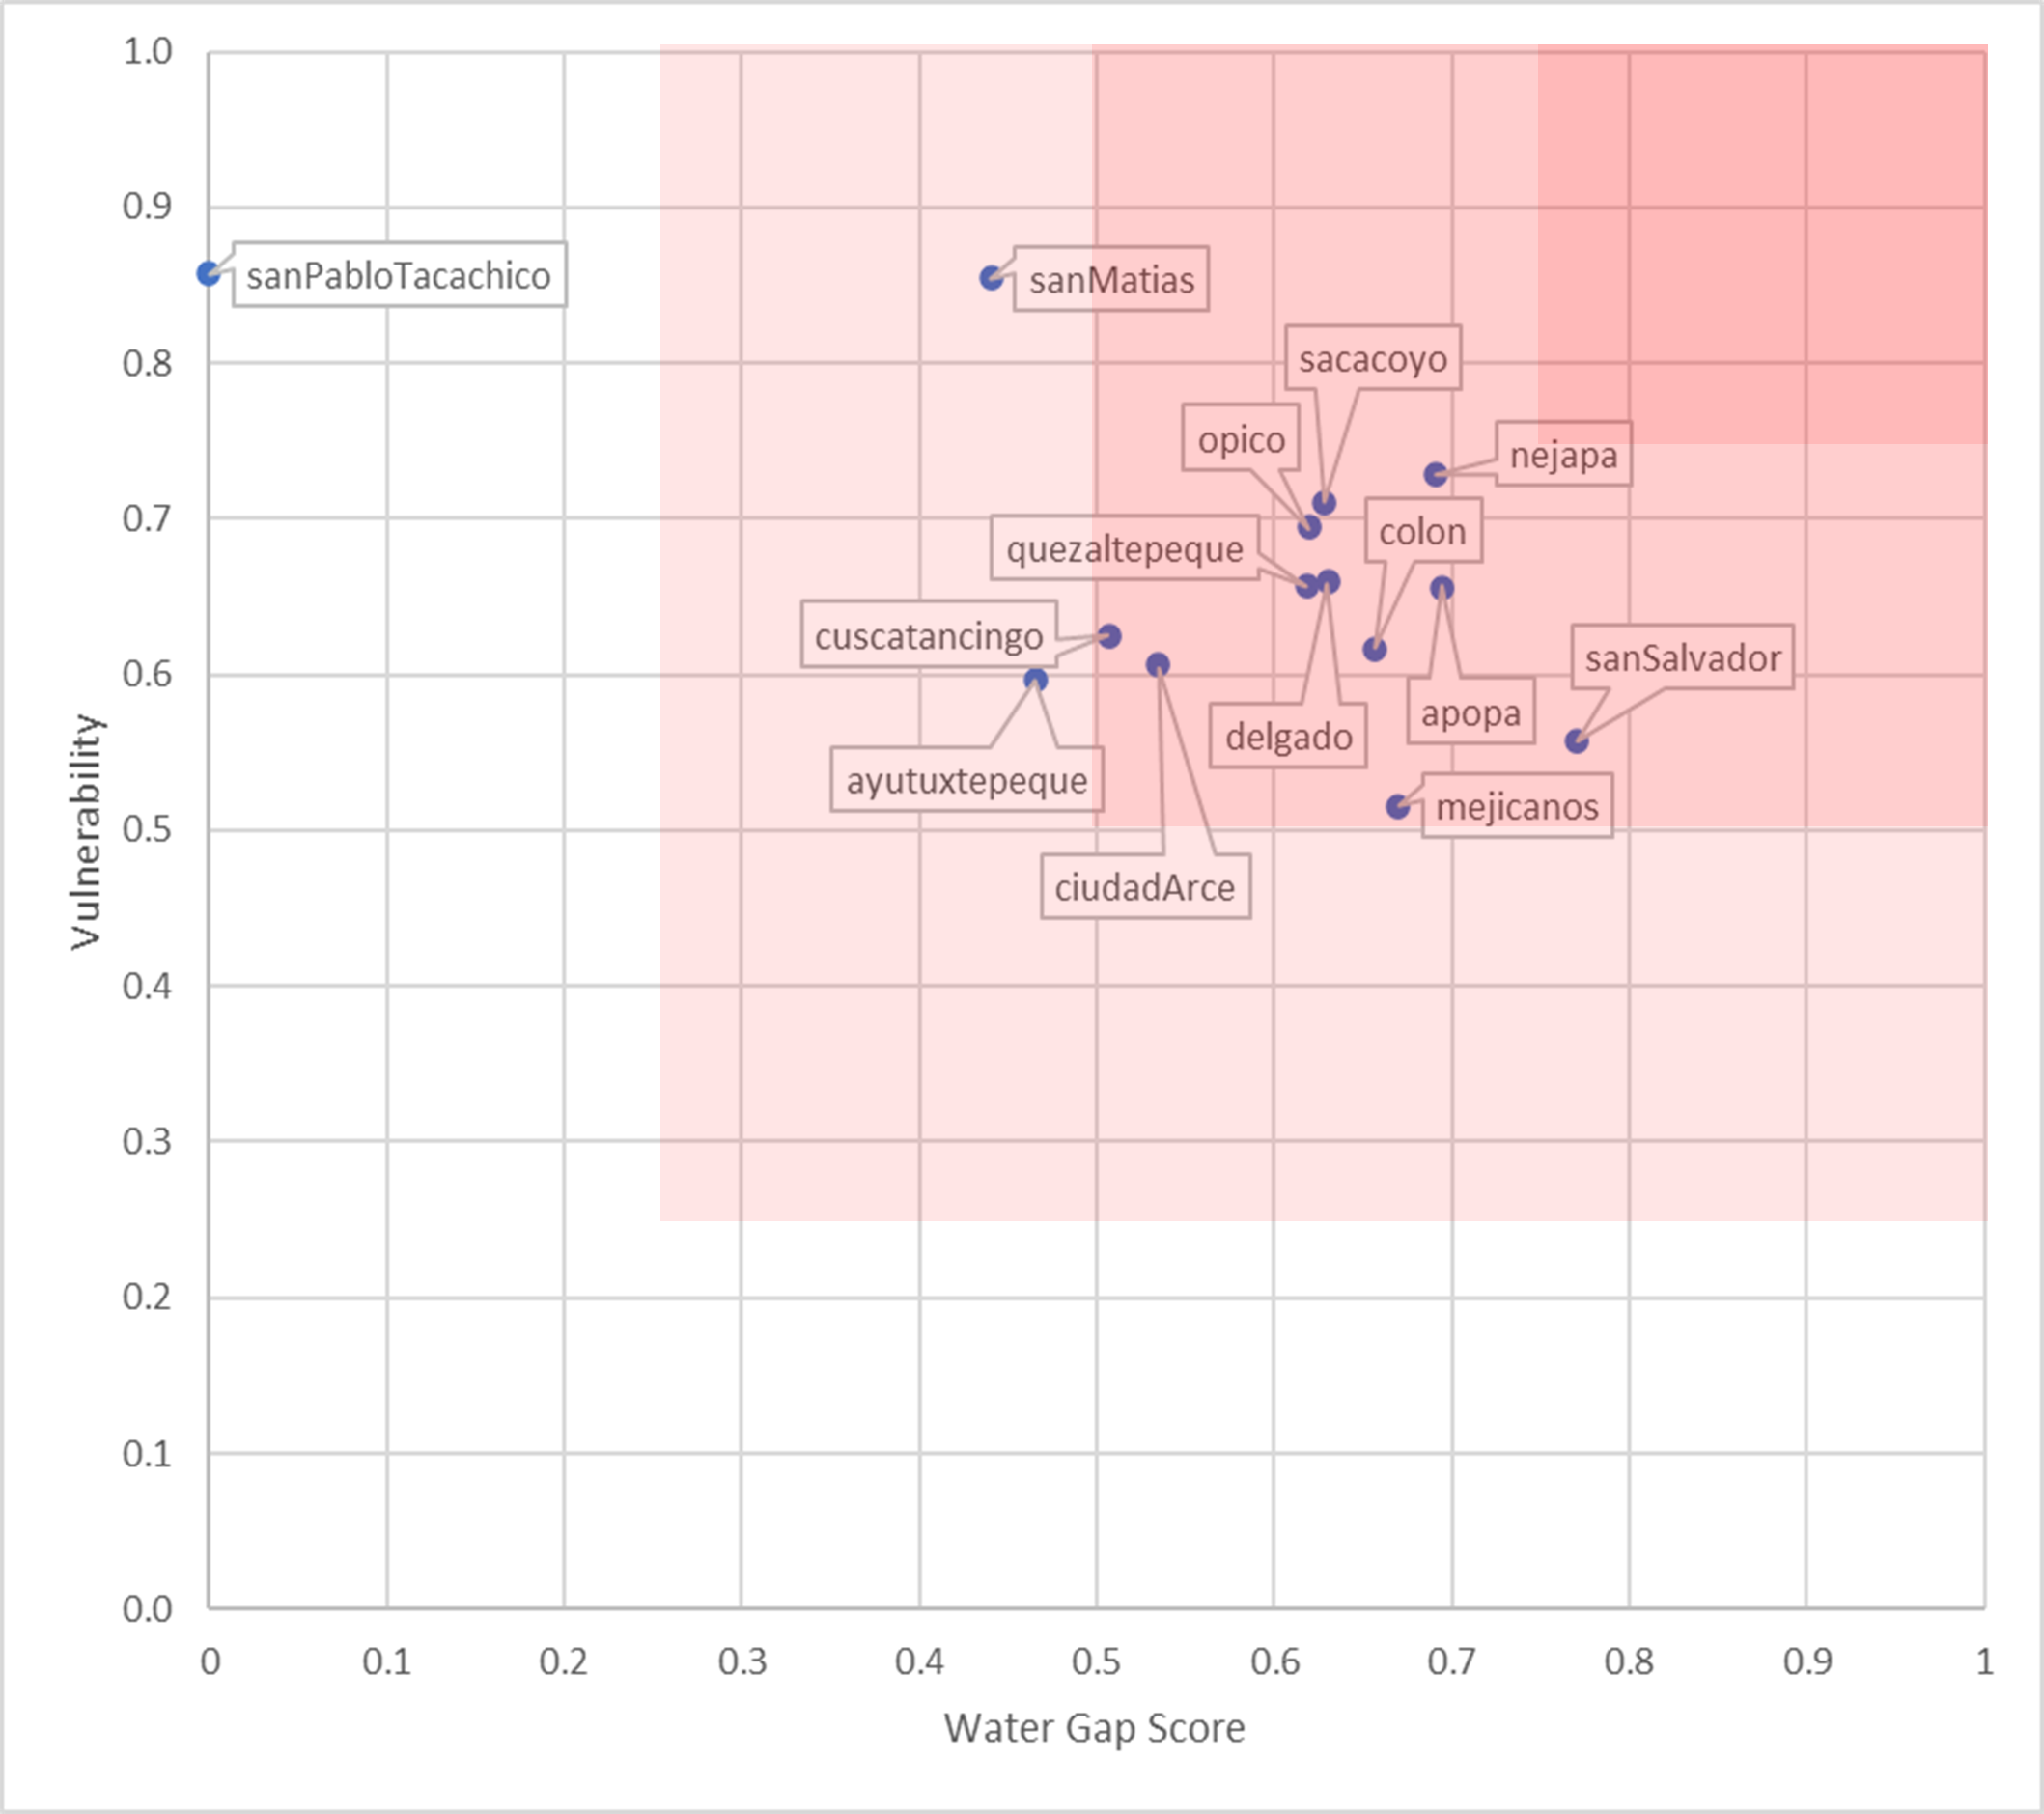
This graph shows the relation between the calculated Water Gap Index (WGI) and the Vulnerability for the period 2010-2019 for all the municipalities.
It is seen that almost all municipalities are in the same area of the graph (high WGI and high vulnerability), except for San Pablo Tacachico, because of its WGI being equal to 0. San Salvador, for example has a higher Water Gap Index than vulnerability, and San Matías is the other way around.
This indicates that for each municipality, the factor that should be tackled to reduce the water scarcity risks might be different. While for San Salvador reducing the gap between availability and demand can have more effect than vulnerability on reducing water scarcity risks, for San Matías, the focus to reduce water scarcity risks should be on reducing vulnerability.
3. Risk Assessment
3.1 Calculation Approach
The WaterLOUPE water scarcity risk analysis shows the relative risks for the different sectors and user groups, now and in the future. The presented risk level of the area is the result of a combination of the hazard (drought conditions, reduced water availability), the exposure of water users in different sectors (domestic, agriculture and industry) and the vulnerability (capacity to cope with water scarcity levels of the different water users in the basin).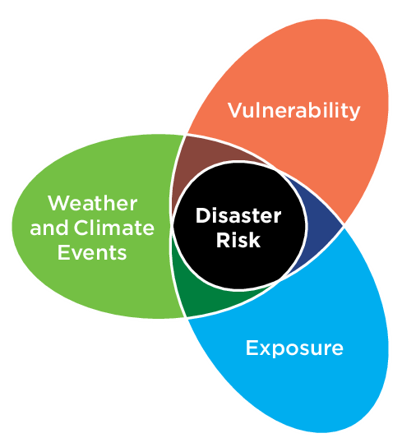
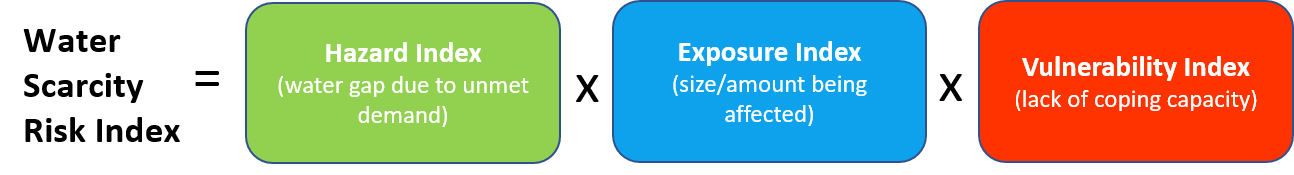
Risk is expressed through the Water Scarcity Index (WSI), as a standardized measure of risk that can range from 0 (low or no risk) to 1 (maximum risk) at district-level and per consumer group/sector.
WSI index is calculated by aggregating hazard, exposure and vulnerability scores, each quantified first separately.
For more information, please refer to the methodology section: WaterLOUPE (deltares.nl)
3.2 Hazard (Water Gap Index)
The Water Gap Index is calculated using the water demand and the water availability, and looking at three components:
- The frequency of the appearance of a water gap (how often the water demand is higher than the water availability)
- The persistence of the water gap (how many months the water demand is higher than the water availability, every time that this occurs)
- The severity of the water gap (how big is the difference between the water demand and the water availability)
More information can be found here: WaterLOUPE (deltares.nl)
This map shows the results of the Water Gap Index, which is composed by Frequency, Persistence and Severity for the selected period.
Basins in green have a lower Water Gap Index, while the ones in red have a larger Water Gap Index.
For the historical period, the Water Gap Index shows that San Salvador is the municipality with the largest score, meaning that it has water scarcity. San Pablo Tacachico is the one with the lowest score, being the one with the best conditions. All the other municipalities have a score in between these two extremes.
For the future scenarios, the results show no significant variations of the Water Gap Index over time and the two SSPs, maintaining the same trend from the historical period.
The similarities in both SSPs is because the effect of SSPs applies only to the demands, which in comparison to the figures of the availability are very small, not causing a large different effect when calculating the Water Gap Index under the two scenarios.
Legend
Zero indicates the lowest, and one indicates the highest hazard.
3.3 Water Gap over time
This graph shows monthly averages of water availability and the water demand in the selected municipality for the period 2010 - 2050.
In general, all municipalities show an increase of the water gap in the future.
3.4 Water users
The barchart shows the comparison between the water availabilities and demands for each of the municipalities and the different periods of evaluation.
3.5 Vulnerability
Vulnerability refers to the degree of susceptibility to, and inability to cope with, the adverse effects of water scarcity. Due to differences in coping capacity, a water deficit impacts every water user or sector differently. Vulnerability is included in the Water Risk Index by using the Marginal Utility Function. More information can be found here: WaterLOUPE (deltares.nl)
For the historical period:
- Municipalities with higher vulnerability: San Pablo Tacachico and San Matías.
- Municipalities with lower vulnerability: San Salvador and Mejicanos.
It can be seen that under the SSP1 scenario, the vulnerability factor is reducing over time, while in the SSP3 it is increasing.
Legend
Zero indicates the lowest, and one indicates the highest vulnerability.
4. Solution Strategies
4.1 From risk assessment to solution strategy
A next step when improving the water security in a basin, is the development of water scarcity solution strategies with all stakeholders. The solution strategies are expected to improve the water security at short to medium time scales, but should also enable the possibility to adapt to future changes (both climatic and socioeconomic).
In the first phases of the development of solution strategies, the results of the water scarcity risk analyses provide information to prioritize areas, sectors, and user groups with high risk and basin characteristics needed to evaluate the technical, environmental, financial, economic and political suitability of measures in that specific basin.
4.2 Developing solution strategies
To compose a water scarcity solution strategy, various mitigation and adaptation measures need to be combined. To evaluate the suitability of measures for the specific basin information about their physical, environmental, socio-economic, and political characteristics context should be clear to all stakeholders.
WaterLOUPE 2.0 contains an Water Scarcity Actions Wayfinder that provides such information for a range of water scarcity solution measures. The Water Scarcity Actions Wayfinder can be viewed here.
Sources of data
Water availability
Surface Water
The water availability of the surface water is represented by the discharge in the rivers. We used the global hydrological model PCR-GLOBWB and regional data to calculate the discharge.
Data used for the calculation:
- Annual flow averages for the stations Jocote, Belloso, Tamarindo, Guazapa and Las Pavas (MARN viewer)
- Flows by PCR-GLOBWB (global model)
Ground Water
The groundwater availability has been calculated as the average recharge per municipality. The aquifers in the region are considered as part of the ESA-06 group, which is of great extension and storage capacity, as well as being the groundwater a strategic resource for the maintenance of a variety of socio-economic activities.
Population
The population values were obtained based on the document “El Salvador: Estimaciones y Proyecciones de Población Municipal 2005-2025” developed by the Ministry of Economics (2014).
Water Demand
Domestic
The current domestic water demand was extracted from the annual reports from ANDA (Nacional Administration office for water networks and sewage) for years 2010-2017.
Industrial
The 2011 industrial demand value from the dashboard was correlated with the industrial sector number of employees reported for years 2012, 2017 and 2022 in the “Elaboración del Plan Nacional de Gestión Integrada del Recurso Hídrico de El Salvador, con énfasis en Zonas Prioritarias. Anexo 02. Usos y demandas de agua actuales y futuras” report. Based on this correlation, the annual industrial water demands were estimated for years 2010-2020.
Agriculture
The points representing the agriculture water demand for 2012 on a monthly scale were obtained from the viewer (see source below):