Chennai - Analyse the risk
About
This study examines water scarcity risks in the Chennai River Basin under current and future conditions. The risk of water scarcity is estimated for different geographic areas and socioeconomic groups based on the occurrence of water deficit (hazard), as well as the vulnerability and exposure to the hazard. For a more detailed explanation of the methodology, please click here
The water scarcity risk is evaluated for eleven areas, including eight sub-basins within the Chennai River Basin. In addition, three sub-basins that cross the metropolitan area of Chennai are further divided based on socioeconomic differences.
Future risk is assessed for two future scenarios: SSP2 (Middle of Road) and SSP3 (Regional Rivalry). The former is an optimistic scenario where the world continues on a path that aligns with historical patterns. The latter (SSP3) is a pessimistic scenario where regional conflicts result in a 10% reduction in water availability between 2010 and 2050.
1. Introduction
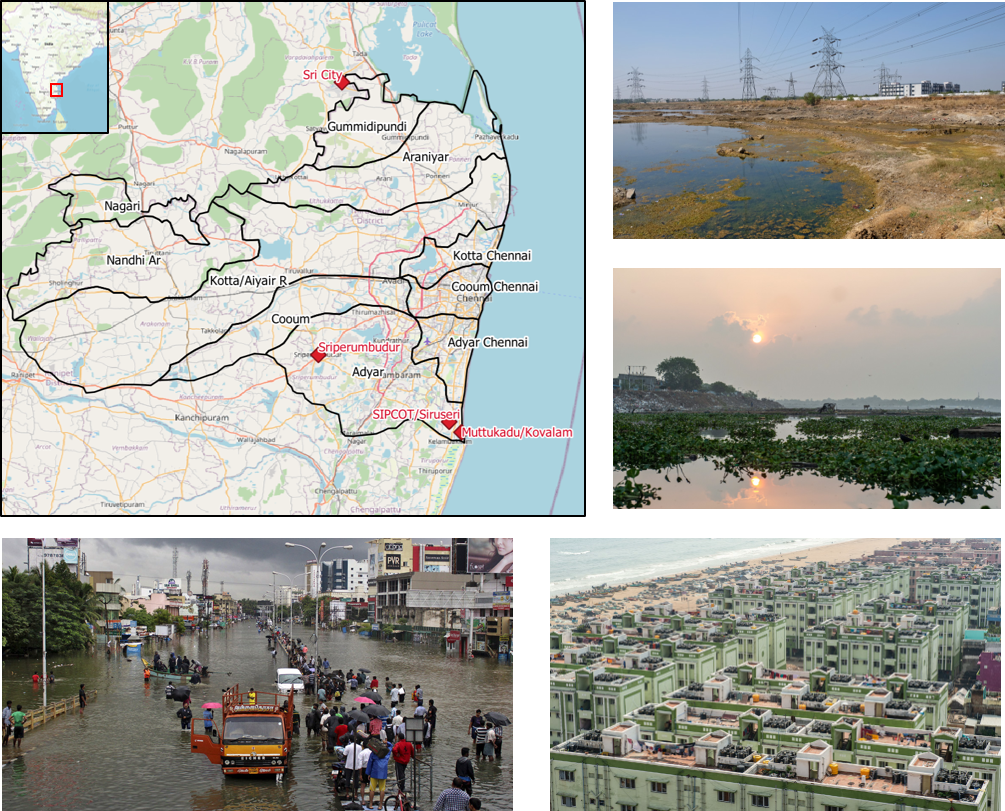 Chennai, the capital city of Tamil Nadu in South India, has a population of about 10.6 million, according to the 2019 census. The Chennai basin includes the metropolitan area of Chennai and the nearby industrial and business areas.
Chennai is a bustling city and one of the region's largest centers for industry and commerce. The city boasts a diverse range of economic activities, including automobile manufacturing, software services, hardware production, financial services, and textiles. Two major industrial zones, Siruseri and Sriperumbudur, are situated nearby, while the Muttukadu-Kovalam region to the south is also experiencing growth in business. Agriculture is also a significant economic contributor in the southern and western parts of the region, with rice and various types of millet being the primary crops cultivated.
Throughout history, the agricultural sector has been the primary user of water, followed by both urban and rural consumers. Water is distributed to these users through three main methods: piped networks, private groundwater wells, and private tankers. Piped water is primarily sourced from rain-fed reservoirs and well fields located outside of the city. However, the piped network's coverage is limited beyond the metropolitan zone. About 70% of Chennai's population relies on private groundwater wells as an additional source of water, which are also heavily relied upon for agricultural production. Private tankers supply a smaller fraction of household water and are generally a more expensive option.
2. Water scarcity Risk
The water scarcity risk map for the Chennai Basin is shown for the highlighted area.
The risk of water scarcity gradually increases over time and is expected to be particularly high between 2035 and 2045 under both climate scenarios. This heightened risk is largely driven by increased water demand resulting in more frequent and prolonged water deficits.
Regarding domestic water use, the risk of water scarcity is expected to increase, but not all socioeconomic groups will be affected similarly. Those below the poverty line face the highest risk, especially after 2030. The rural population below the poverty line, particularly in the Nedungundram district, is also at high risk. The agriculture sector's risk is low, even in 2035-2045. The industry sector faces a higher risk, especially in the Kotta/Aiyair area.
Legend
Zero indicates the lowest, and one indicates the highest risk.
3. Risk Assessment
Water scarcity risks are calculated using normalized hazard, exposure, and vulnerability indices. For more information, please refer to the methodology section at the end.
3.1 Water users and resources
The Chennai Basin's main water users are agriculture, population, and industry. The population's water demand can be categorized by two factors: urban or rural populations and populations above or below the poverty line.
Under both SSP2 and SSP3 scenarios, water demand within the Chennai Basin is anticipated to increase. However, while demand is growing, water availability is expected to remain steady under SSP2 but decrease due to climate change under SSP3.
3.2 Hazard (water gap)
The hazard map depicts the water gap, the deficit that occurs when the total demand for water exceeds the available water.
For the 2010-2019 period, the hazard from the water gap is generally low, indicated by a gap score of less than 0.4. However, the basin is expected to face more frequent and severe water deficits in subsequent periods, especially after 2025-2035, resulting in a water gap score greater than 0.5.
Across the basin, the northern areas including Gummimdipundi and Araniyar faced more severe water deficits during the 2010-2019 period. However, this water gap is expected to remain stable in the future under both future scenarios. On the other hand, more urbanized areas such as Kotta Aiyair are expected to face an increasing water gap in the future.
Legend
Zero indicates the lowest, and one indicates the highest hazard.
3.3 Exposure
The exposure map refers to the relative size of people or property in each area subject to the negative consequences of water deficits.
The results display the spatial variability in exposure for all users based on the demographic differences between the areas. The exposure for the agriculture, industry, and rural population is highest in the Kotta Aiyair area. In contrast, the exposure for the urban population is highest in Cooum and Adyar, which is closer to Chennai city.
Legend
Zero indicates the lowest, and one indicates the highest exposure.
3.4 Vulnerability
The vulnerability chart refers to each water user group's characteristics, making them more susceptible to the negative consequences of water deficits.
For the Chennai basin, the vulnerability of each water user is defined based on common literature and assumed to stay the same over time. As a general rule of thumb, poorer populations are more vulnerable due to their limited coping capacity.
Legend
Zero indicates the lowest, and one indicates the highest vulnerability.
4. Solution Strategies
4.1 From risk assessment to solution strategy
A next step when improving the water security in a basin, is the development of water scarcity solution strategies with all stakeholders. The solution strategies are expected to improve the water security at short to medium time scales, but should also enable the possibility to adapt to future changes (both climatic and socioeconomic).
In the first phases of the development of solution strategies, the results of the water scarcity risk analyses provide information to prioritize areas, sectors, and user groups with high risk and basin characteristics needed to evaluate the technical, environmental, financial, economic and political suitability of measures in that specific basin.
4.2 Developing solution strategies
To compose a water scarcity solution strategy, various mitigation and adaptation measures need to be combined. To evaluate the suitability of measures for the specific basin information about their physical, environmental, socio-economic, and political characteristics context should be clear to all stakeholders.
WaterLOUPE 2.0 contains an information catalogue that provides such information for a range of water scarcity solution measures.