Lima - Analyse the risk
1. Water Scarcity Risk
1.1 Introduction to the area
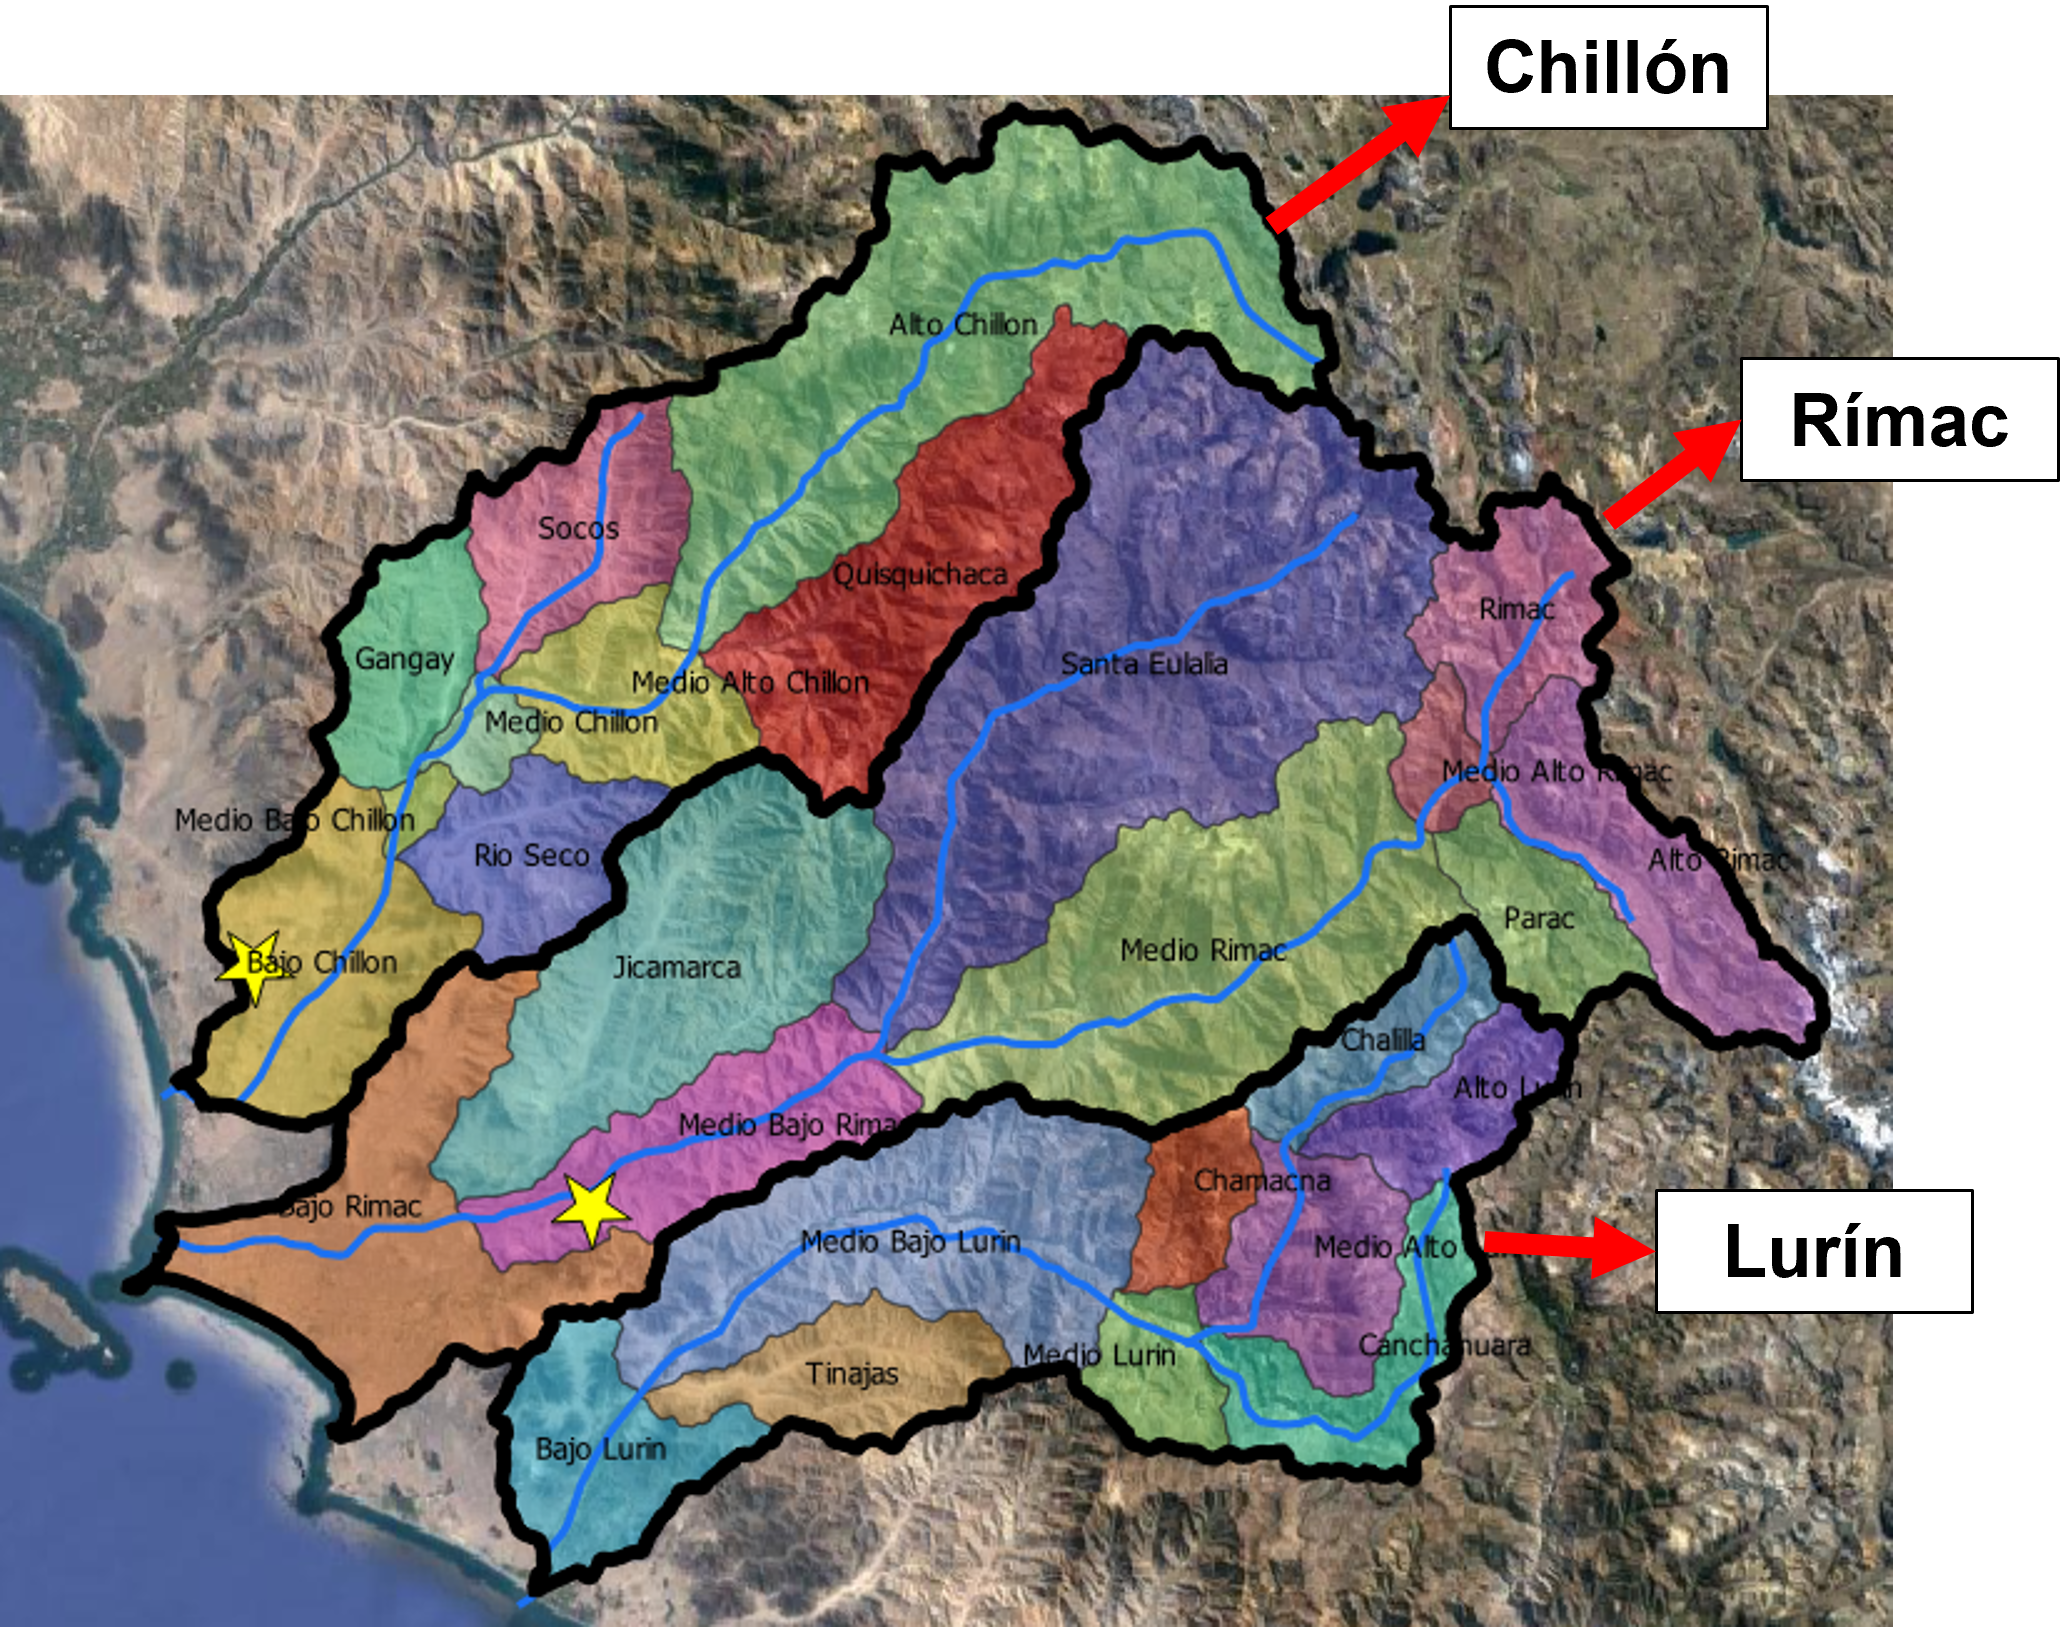
The Lima case study area considers de basins of the rivers Rimac, Chillón and Lurin, all in the province of Lima.
This is a highly populated area (8.5M people) gathering 30% of the total population in the country. In the region, 80% of the population lives in urban areas. The arid climate that characterizes this area has an uneven distribution of water in time and space. The highlands receive 800-1500mm of rain per year, while downstream, close to the city, the precipitation can be as little as 50mm per year.
Due to the high demand in the province of Lima, there are water transfers from a system of reservoirs upstream in the Rimac basin, but also in the Mantaro basin located west from the Rimac. From the Mantaro basin, water is transferred through tunnels crossing the Andes.
Water resources of the three basins are managed together, but water availability and demand are much unevenly distributed in the three basins. With the objective to show these differences and the differences this causes in water scarcity risks, the unit of analysis of this study is thus sub-basin.
The WaterLOUPE water scarcity risks dashboard calculates and presents the relative risks for different sectors and users in the mentioned river sub-basins, now and in the future.
Water Scarcity Index (WSI)
The Water Scarcity Index (WSI) is composed by the Water Gap Score and the Vulnerability Index. Basins in green have a lower Water Scarcity Index, while the ones in red have a larger Water Scarcity Index.
Historical WSI (2010-2019)
Most of the sub-basins have a low WSI, including the Bajo Rimac where most of the population lives. However, Bajo Chillón y Bajo Lurin, both very high populated areas, have a medium WSI. This score is mostly due to the Water Gap Score.
The southern sub-basins of the Lurin basin (Alto Lurin, Chalila, Medio Alto Lurin, Canchahuara and Medio Lurin) and the Socos basin in the north, score the highest Water Scarcity Index. These basins do not have a high population density, but they experience severe and persistence water scarcity and also are the most vulnerable sub-basins (highest poverty incidence and equity weight).
Future WSI (2020-2045)
The WSI For both SSP2 and SSP3 is the highest for the Lurin sub-basins, and particularly for the Alto Lurin, Chalila, Medio Alto Lurin, Medio Lurin and Canchahuara. Other sub-basins with a high risk are Medio Bajo Lurín, Bajo Lurín, Alto Chillón and Gangay. This last group of basins does not have a high WSI currently, but will have a much higher one by 2040.
1.2 Water Scarcity Index
More information on the scenarios
- Two socioeconomic scenarios* are used as basis for future water demand predictions based on the Shared Socioeconomic Pathways of the IPCC
- SSP2 = ‘middle of the road’: a continuation of current population and GDP growth trend – urbanization trend continues, pressure on both domestic and industrial water demand will increase, vulnerability will go down as poverty levels will continue to decrease
- SSP3 = ‘Fragmentation’: characterized by high population growth and low economic (GDP) growth – population growth mainly driven by high rural growth, urbanization trend slows down in pace – due to the high population growth and high poverty incidence, both pressure on domestic water demands will increase while vulnerability will stay high.
- One Climate change scenario is used: RCP 8.5 which is a high climate change scenario, leading to more pressure on water availability. In this scenario, emissions continue to rise throughout the 21st century. This leads to greater temperature increases. SENAMHI (2016) reports a possible sign of increased average precipitation in the basins but there is still a great deal of uncertainty in these results.
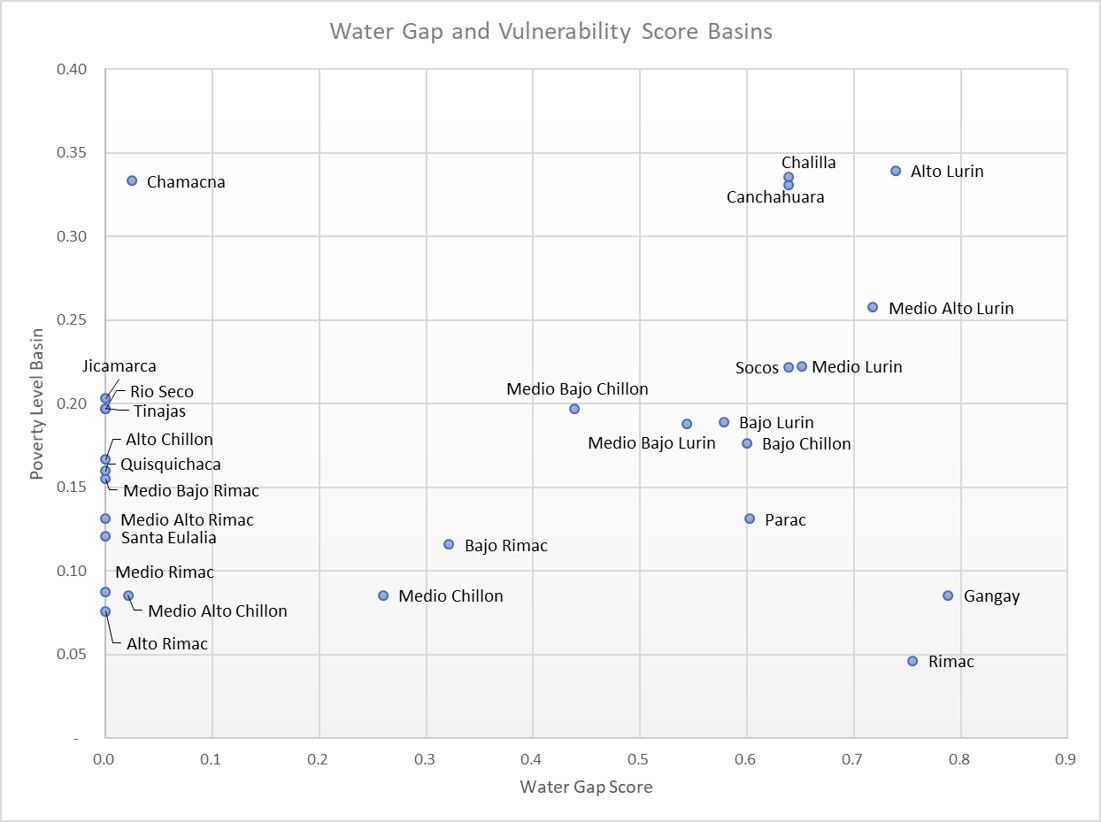
This graph shows that the sub-basins that are most at risk are the ones for which both the Water Gap Score and the Vulnerability are high (Alto Lurin, Chalila, Canchahuara and Medio Alto Lurin).
Basins like Gangay or Rimac have a high Water Gap Score but a low vulnerability score, which probably makes them more resilient. Other basins, such as Chamacna, have a high vulnerability level but almost no water gap.
1.3 Main Conclusions About Risk
Hydrological and social-economic related risks
- Uneven distribution of availability and demand pose a high risk in the basins downstream.
- Water allocation rules between sectors and sub-basins are key to ensure no water gap appears in the area.
- The densely populated downstream basins and the rapidly increasing population are the main drivers of te risk, together with the high rates of poverty of some basins
Environmental risks
- The arid climate does not allow for a rich biodiversity in this area and therefore environmental risks are low
2. Risk assessment
2.1 Calculation approach
The WaterLOUPE water scarcity risk analysis shows the relative risks for the different sectors and user groups, now and in the future. The presented risk level of the area is the result of a combination of the hazard (drought conditions, reduced water availability), the exposure of water users in different sectors (domestic, nature, and economic) and the vulnerability levels of the different water users in the basin.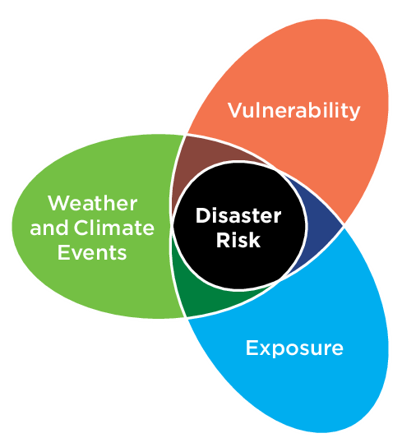
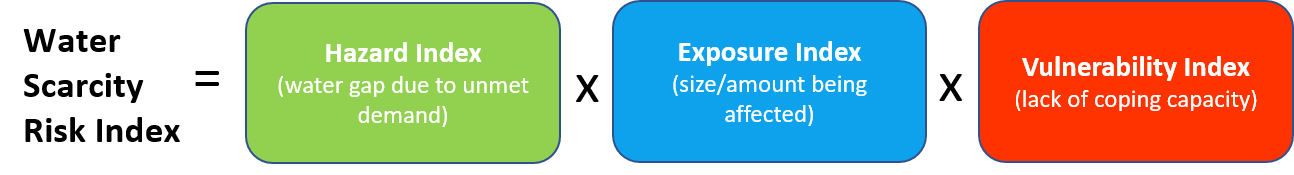
Risk is expressed through the Water Scarcity Index (WSRI), as a standardized measure of risk that can range from 0 (low or no risk) to 1 (maximum risk) at district-level and per consumer group/sector.
WSI index score is calculated by aggregating hazard, exposure and vulnerability scores, each quantified first separately.
2.2 Water demand and availability
This chart provides information about the water demand from the different sectors and the water availability in the selected sub-basin. The information is shown for 2015, 2020 and two 10-year periods: 2025 - 2035, and 2035 - 2045. For each period, the average water demand and availability are shown.
Sources
- Water Availability
“Estudio de Vulnerabilidad climática de los recursos hídricos en las cuencas de los ríos Chillón, Rímac, Lurín y parte alta del Mantaro – Resumen Ejecutivo” (SENAMHI, 2016 - 01401SENA-38.pdf): Pp anual promedio (mm), area (km2), Pp media mensual multianual per subbasin.
“Estudio Hidrológico de la Unidad Hidrográfica Chillón” (ANA, 2019 - ANA0003126_1.pdf): annual average Pp from 2010 to 2018 for Chillón basin.
SNIRH website of ANA: Use of Milloc and Río Blanco flow stations to represent allocations from Marcapomacoha-Mantaro system.
SEDAPAL. (2014). Plan Maestro Optimizado 2015 - 2044/Plan Maestro de los Sistemas de Agua Potable y Alcantarillado. Servicio de Agua Potable y Alcantarillado de Lima.
Water Demand - Observatorio del Agua website (http://observatoriochirilu.ana.gob.pe/)
2.3 Water Gap over time
This graph shows the water availability and the water demand in the selected sub-basin for the period 2010 - 2045. The graph presents monthly averages of water availability and water demand. In some sub-basins, like in Gangay or Bajo Rimac, there is a water gap almost every year between May and September, while in other sub-basins, like Medio Bajo Lurín or Santa Eulalia, there is never a water gap as the demand is really low and the availability high.
The future water gap under SSP2 becomes bigger in the sub-basins that already had a water gap in the past, like in Bajo Rimac. That is mostly due to the increase of population and water demand, and also decrease of water availability. In the upstream basins, where water demands is very low, there is also no or very little water gap appearing in the future. The water gap appears in the months May to September. The results under SSP3 are very similar to under SPP2. In the basins where the population increase is more notorious in SSP3, the water gap is also bigger.
2.4 Water Gap Score
These maps show the results of the Water Gap Score, which is composed by Frequency, Persistence and Severity for the selected period.
The Water Gap Score shows that mostly sub-basins in the north of Lima and south-eastern sub-basins in the Lurin basin have a water gap. Persistence and Severity are the two components of the index that contribute most to the Water Gap Score in this area.
Basins in green have a lower Water Gap Score, while the ones in red have a larger Water Gap Score.
2.5 Water Gap Score per sector
The Water Gap Score per sector shows that different sectors are affected per sub-basin. For example in the northern basin of Gangay (in dark orange), both the domestic sector and the agriculture have a high WGS, while the industrial sector has a low one as the water demand is lower. In the south, sub-basins such as Medio-alto Lurin and Alto Lurin present a high WGS for the domestic sector, and Alto Lurin also for the Industrial sector even if water demand for industry is low compared to other sub-basins. For both Medio alto Lurin y alto Lurin the WGS for the agricultural sector is low.
Basins in green have a lower Water Gap Score per sector, while the ones in red have a Water Gap Score per sector.
2.6 Exposure and Vulnerability
Exposure and vulnerability are an essential part of water scarcity risk. The map in this section provide relevant exposure and vulnerability information (proxies) for each river basin.
Population Density
In the three basins, population is concentrated downstream, reaching values of 14,000 inhabitants per km2, while upstream, sub-basins in the Chillón and Lurín basins are practically inhabited. Most of the exposed population is thus downstream of the area.
Basins in green have a lower Water Gap Score, while the ones in red have a larger Water Gap Score.
Basins in green have a lower Population density (hab/km2), while the ones in red have a larger Population density.
Poverty
Most of the basing have a poverty incidence between 15 and 20%, being the sub-basins with the highest percentage of poor inhabitants (between 30 and 35%) the southern sub-basins within the Lurin basin (Alto Lurin, Chamacna, Chalila, and Canchahuara).
Basins in green have a lower Poverty incidence, while the ones in red have a larger Poverty incidence.
Equity weight
In terms of the Equity weight, the southern sub-basins within the Lurin basin (Alto Lurin, Chamacna, Chalila, and Canchahuara) have the highest score. The sub-basins with less poverty incidence and lower equity weight are Rimac, Medio Rimac, Gangay, Medio Chillón y Medio Alto Chillón.
Basins in green have a lower Equity Weight, while the ones in red have a larger Equity Weight.
More information
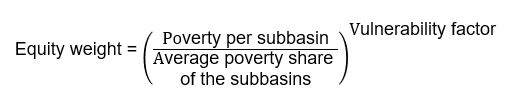
Where:
Average poverty share of the subbasins = 17.91
Vulnerability factor = 0.5
3. Solution Strategies
3.1 From risk assessment to solution strategy
A next step when improving the water security in a basin, is the development of water scarcity solution strategies with all stakeholders. The solution strategies are expected to improve the water security at short to medium time scales, but should also enable the possibility to adapt to future changes (both climatic and socioeconomic).
In the first phases of the development of solution strategies, the results of the water scarcity risk analyses provide information to prioritize areas, sectors, and user groups with high risk and basin characteristics needed to evaluate the technical, environmental, financial, economic and political suitability of measures in that specific basin.
3.2 Developing solution strategies
To compose a water scarcity solution strategy, various mitigation and adaptation measures need to be combined. To evaluate the suitability of measures for the specific basin information about their physical, environmental, socio-economic, and political characteristics context should be clear to all stakeholders.
WaterLOUPE 2.0 contains an Water Scarcity Actions Wayfinder that provides such information for a range of water scarcity solution measures. The Water Scarcity Actions Wayfinder can be viewed here.